

Wondering which rental markets investors are watching in 2022? Read our latest post: 60 Up-and-Coming Real Estate Markets Where Rental Investors & Property Managers Can Grow in 2022
Surprising cities are attracting new residents, businesses, and investment dollars at the expense of the United States’ most influential real estate markets. It’s a story that Buildium’s up-and-coming markets list has tracked for three years running; and it’s also visible in the Census Bureau’s most recent analysis of domestic migration. On any given day, as Phoenix gained 170 residents, New York City lost 545. Dallas grew by 127 residents each day as Los Angeles shrank by 325. Las Vegas gained 97 new residents per day, and Chicago lost 230.
Chart of Accounts
Want clearer, cleaner books? What about a more useful view into your properties or just easier accounting in general?
Get the GuideWhat’s going on here? You’ve heard the news: The supply of affordable homes simply isn’t keeping up with the demand in primary markets like New York City, San Francisco, and Boston. Long-term residents are being priced out of these expensive markets as lucrative jobs attract an affluent demographic that can afford to pay more for housing.
Where do residents go when they can’t afford their cities anymore? The answer is revealed in this year’s list: Many move to nearby suburbs and satellite cities, which are increasingly developing the transit options and walking-distance attractions that have drawn residents to downtown neighborhoods over the last decade. A smaller portion make the leap to more affordable cities outside of their current metro area.
What differentiates the up-and-coming cities on our list from the rest is a kind of multifaceted growth that doesn’t just happen anywhere. It takes job growth across a range of industries—e.g. technology, manufacturing, and service professions—which benefits a diverse mix of residents and insulates emerging markets from the effects of a recession. It requires a balance between affordability (for residents looking for a place to live, investors looking to get in on the ground floor, and businesses looking for a place to expand) and growth (so that homebuyers, investors, and businesses can count on steady returns over time).
Because no place is perfect, we’ve developed a proprietary method of ranking real estate markets based on just about any factor you can measure, pulling from trusted data sources like the Census Bureau to make our evaluations as objective and balanced as possible. All in all, we considered over 100 data points for each of 340 up-and-coming markets to put the health of their real estate markets, local economies, and population growth to the test. (See all of the factors that we took into consideration this year in the Methodology section.)
In a time of rapidly changing conditions and compressing cap rates in real estate markets across the U.S., we hope that this year’s list empowers rental owners, property managers, and investors to make the best possible decisions in 2020.
So, here’s how this works: Scan our Tier I and Tier II lists to learn which 50 cities are our best bets for investing in rental property in 2020, as well as 50 more that show the potential to rise up the ranks in the years to come. You can jump straight to a city’s summary by clicking on the links below, or just scroll down to view the full rankings.
Tier I: 50 Top Markets for Real Estate Investment in 2020
Select your city to jump straight to that section.
Arlington, TX | Atlanta, GA | Austin, TX | Boise, ID | Chandler, AZ
Charleston, SC | Charlotte, NC | Cincinnati, OH | Colorado Springs, CO
Columbus, OH | Denver, CO | Des Moines, IA | Durham, NC
Fort Wayne, IN | Fort Worth, TX | Gilbert, AZ | Grand Prairie, TX
Grand Rapids, MI | Hillsboro, OR | Huntsville, AL | Indianapolis, IN
Jacksonville, FL | Kansas City, MO | Las Vegas, NV | Lexington, KY
Lincoln, NE | Madison, WI | Memphis, TN | Milwaukee, WI
Minneapolis, MN | Nashville, TN | Norfolk, VA | Oklahoma City, OK
Omaha, NE | Orlando, FL | Phoenix, AZ | Pittsburgh, PA | Portland, OR
Raleigh, NC | Richmond, VA | Sacramento, CA | Salt Lake City, UT
San Antonio, TX | Spokane, WA | St. Paul, MN | St. Petersburg, FL
Tacoma, WA | Tampa, FL | Tucson, AZ | Virginia Beach, VA
Tier II: 50 More Markets to Watch in 2020
Select your city to jump straight to that section.
Akron, OH | Albuquerque, NM | Arvada, CO | Athens, GA
Aurora, CO | Bakersfield, CA | Baltimore, MD | Birmingham, AL
Buffalo, NY | Cape Coral, FL | Cedar Rapids, IA | Chattanooga, TN
Cleveland, OH | Dallas, TX | Denton, TX | Detroit, MI | El Paso, TX
Gainesville, FL | Green Bay, WI | Henderson, NV | Houston, TX
Irving, TX | Jersey City, NJ | Knoxville, TN | Louisville, KY
Manchester, NH | Mesa, AZ | Murfreesboro, TN | North Charleston, SC
Oakland, CA | Ontario, CA | Palm Bay, FL | Peoria, AZ
Philadelphia, PA | Port St. Lucie, FL | Portland, ME | Providence, RI
Reno, NV | Riverside, CA | Roswell, GA | Salem, OR | San Bernardino, CA
San Diego, CA | Seattle, WA | Springfield, MO | St. Louis, MO
Tallahassee, FL | Vancouver, WA | West Palm Beach, FL | Winston-Salem, NC
Tier I: The Top 50 Up-and-Coming Real Estate Markets to Watch in 2020

#1: Boise, Idaho
- Metropolitan statistical area: Boise City, ID
Boise Population Growth
- Population: 228,790 (Census Bureau – 2018 estimate)
- Population growth since 2017: 2.87% (Census Bureau – U.S. average is 0.62%)
- Population growth since 2010: 18.47% (Census Bureau – U.S. average is 5.96%)
- 5-year projected population growth: 1.6% (PwC/ULI – U.S. average is 0.7%)
Boise Rental Market
- Median 1-bedroom rent: $741 (Rentonomics – U.S. average is $961)
- Median 2-bedroom rent: $951 (Rentonomics – U.S. average is $1,192)
- Year-over-year rent growth: 2.5% (Rentonomics – U.S. average is 1.4%)
- Rent list price per square foot: $1.06 (Zillow – U.S. average is $1.14)
- Rental breakeven horizon: 2.2 years (Zillow – U.S. average is 2.0, meaning that buying is more financially advantageous than renting after 2 years)
- Rent to cost of ownership ratio: 0.7 (PwC/ULI – U.S. average is 0.8, meaning that the average rent payment in the area is 20% lower than a mortgage payment)
- Rent as % of household income: 22.3% (PwC/ULI – U.S. average is 33.4%, meaning that the average household spends 33.4% of its income on rent, though under 30% is considered ideal)
Boise Housing Market
- Median home value: $323,540 (Zillow – U.S. average is $243,225)
- Year-over-year home value growth: 10.4% (Zillow – U.S. average is 3.8%)
- 1-year projected home value growth: 6.2% (Zillow – U.S. average is 2.2%)
- Median list price per square foot: $206 (Zillow – U.S. average is $154)
- Home affordability index: 155.5 (PwC/ULI – U.S. average is 153.0, meaning a resident making the median salary can afford to buy a median-priced home in the area 1.53 times over)
Boise Economy
- 5-year projected employment growth: 1.4% (PwC/ULI – U.S. average is 0.6%)
- Cost of living index: 92.9 (City Data – U.S. average is 100)
- Cost of doing business index: 95.6 (PwC/ULI – U.S. average is 100)

#2: Austin, Texas
- Metropolitan statistical area: Austin-Round Rock-Georgetown, TX
Austin Population Growth
- Population: 964,254 (Census Bureau – 2018 estimate)
- Population growth since 2017: 2.51% (Census Bureau – U.S. average is 0.62%)
- Population growth since 2010: 26.34% (Census Bureau – U.S. average is 5.96%)
- 5-year projected population growth: 2.2% (PwC/ULI – U.S. average is 0.7%)
Austin Rental Market
- Median 1-bedroom rent: $1,192 (Rentonomics – U.S. average is $961)
- Median 2-bedroom rent: $1,471 (Rentonomics – U.S. average is $1,192)
- Year-over-year rent growth: 3.1% (Rentonomics – U.S. average is 1.4%)
- Vacancy rate: 7.0% (Census Bureau – U.S. metropolitan average is 6.7%)
- Percentage of residents who rent their homes: 43.9% (Census Bureau – U.S. metropolitan average is 37.1%)
- Rent list price per square foot: $1.58 (Zillow – U.S. average is $1.14)
- Rental breakeven horizon: 3.0 years (Zillow – U.S. average is 2.0, meaning that buying is more financially advantageous than renting after 2 years)
- Rent to cost of ownership ratio: 0.6 (PwC/ULI – U.S. average is 0.8, meaning that the average rent payment in the area is 20% lower than a mortgage payment)
- Rent as % of household income: 18.4% (PwC/ULI – U.S. average is 33.4%, meaning that the average household spends 33.4% of its income on rent, though under 30% is considered ideal)
Austin Housing Market
- Median home value: $388,065 (Zillow – U.S. average is $243,225)
- Year-over-year home value growth: 4.7% (Zillow – U.S. average is 3.8%)
- 1-year projected home value growth: 2.8% (Zillow – U.S. average is 2.2%)
- Median list price per square foot: $230 (Zillow – U.S. average is $154)
- Home affordability index: 145.8 (PwC/ULI – U.S. average is 153.0, meaning a resident making the median salary can afford to buy a median-priced home in the area 1.53 times over)
Austin Economy
- 5-year projected employment growth: 2.0% (PwC/ULI – U.S. average is 0.6%)
- Cost of living index: 95.6 (City Data – U.S. average is 100)
- Cost of doing business index: 99.6 (PwC/ULI – U.S. average is 100)
Take a deeper dive into the Austin real estate market, as well as other cities in the region: South Central Real Estate Market Trends

#3: Madison, Wisconsin
- Metropolitan statistical area: Madison, WI
Madison Population Growth
- Population: 258,054 (Census Bureau – 2018 estimate)
- Population growth since 2017: 0.89% (Census Bureau – U.S. average is 0.62%)
- Population growth since 2010: 9.08% (Census Bureau – U.S. average is 5.96%)
- 5-year projected population growth: 0.7% (PwC/ULI – U.S. average is 0.7%)
Madison Rental Market
- Median 1-bedroom rent: $842 (Rentonomics – U.S. average is $961)
- Median 2-bedroom rent: $1,015 (Rentonomics – U.S. average is $1,192)
- Year-over-year rent growth: 0.9% (Rentonomics – U.S. average is 1.4%)
- Rent list price per square foot: $1.36 (Zillow – U.S. average is $1.14)
- Rental breakeven horizon: 2.7 years (Zillow – U.S. average is 2.0, meaning that buying is more financially advantageous than renting after 2 years)
- Rent to cost of ownership ratio: 0.6 (PwC/ULI – U.S. average is 0.8, meaning that the average rent payment in the area is 20% lower than a mortgage payment)
- Rent as % of household income: 18.4% (PwC/ULI – U.S. average is 33.4%, meaning that the average household spends 33.4% of its income on rent, though under 30% is considered ideal)
Madison Housing Market
- Median home value: $275,322 (Zillow – U.S. average is $243,225)
- Year-over-year home value growth: 4.0% (Zillow – U.S. average is 3.8%)
- 1-year projected home value growth: 2.3% (Zillow – U.S. average is 2.2%)
- Median list price per square foot: $171 (Zillow – U.S. average is $154)
- Home affordability index: 164.0 (PwC/ULI – U.S. average is 153.0, meaning a resident making the median salary can afford to buy a median-priced home in the area 1.53 times over)
Madison Economy
- 5-year projected employment growth: 1.0% (PwC/ULI – U.S. average is 0.6%)
- Cost of living index: 97.6 (City Data – U.S. average is 100)
- Cost of doing business index: 98.2 (PwC/ULI – U.S. average is 100)
Take a deeper dive into the Madison real estate market, as well as other cities in the region: Great Lakes Real Estate Market Trends

#4: Charlotte, North Carolina
- Metropolitan statistical area: Charlotte-Concord-Gastonia, NC-SC
Charlotte Population Growth
- Population: 872,498 (Census Bureau – 2018 estimate)
- Population growth since 2017: 1.76% (Census Bureau – U.S. average is 0.62%)
- Population growth since 2010: 15.89% (Census Bureau – U.S. average is 5.96%)
- 5-year projected population growth: 1.4% (PwC/ULI – U.S. average is 0.7%)
Charlotte Rental Market
- Median 1-bedroom rent: $989 (Rentonomics – U.S. average is $961)
- Median 2-bedroom rent: $1,154 (Rentonomics – U.S. average is $1,192)
- Year-over-year rent growth: 2.6% (Rentonomics – U.S. average is 1.4%)
- Vacancy rate: 5.6% (Census Bureau – U.S. metropolitan average is 6.7%)
- Percentage of residents who rent their homes: 32.1% (Census Bureau – U.S. metropolitan average is 37.1%)
- Rent list price per square foot: $0.96 (Zillow – U.S. average is $1.14)
- Rental breakeven horizon: 2.0 years (Zillow – U.S. average is 2.0, meaning that buying is more financially advantageous than renting after 2 years)
- Rent to cost of ownership ratio: 0.8 (PwC/ULI – U.S. average is 0.8, meaning that the average rent payment in the area is 20% lower than a mortgage payment)
- Rent as % of household income: 21.0% (PwC/ULI – U.S. average is 33.4%, meaning that the average household spends 33.4% of its income on rent, though under 30% is considered ideal)
Charlotte Housing Market
- Median home value: $245,618 (Zillow – U.S. average is $243,225)
- Year-over-year home value growth: 4.9% (Zillow – U.S. average is 3.8%)
- 1-year projected home value growth: 4.5% (Zillow – U.S. average is 2.2%)
- Median list price per square foot: $153 (Zillow – U.S. average is $154)
- Home affordability index: 156.9 (PwC/ULI – U.S. average is 153.0, meaning a resident making the median salary can afford to buy a median-priced home in the area 1.53 times over)
Charlotte Economy
- 5-year projected employment growth: 1.3% (PwC/ULI – U.S. average is 0.6%)
- Cost of living index: 92.4 (City Data – U.S. average is 100)
- Cost of doing business index: 95.0 (PwC/ULI – U.S. average is 100)

#5: Indianapolis, Indiana
- Metropolitan statistical area: Indianapolis-Carmel-Anderson, IN
Indianapolis Population Growth
- Population: 867,125 (Census Bureau – 2018 estimate)
- Population growth since 2017: 1.08% (Census Bureau – U.S. average is 0.62%)
- Population growth since 2010: 8.51% (Census Bureau – U.S. average is 5.96%)
- 5-year projected population growth: 0.9% (PwC/ULI – U.S. average is 0.7%)
Indianapolis Rental Market
- Median 1-bedroom rent: $706 (Rentonomics – U.S. average is $961)
- Median 2-bedroom rent: $874 (Rentonomics – U.S. average is $1,192)
- Year-over-year rent growth: 2.0% (Rentonomics – U.S. average is 1.4%)
- Vacancy rate: 9.9% (Census Bureau – U.S. metropolitan average is 6.7%)
- Percentage of residents who rent their homes: 35.7% (Census Bureau – U.S. metropolitan average is 37.1%)
- Rent list price per square foot: $0.81 (Zillow – U.S. average is $1.14)
- Rental breakeven horizon: 1.4 years (Zillow – U.S. average is 2.0, meaning that buying is more financially advantageous than renting after 2 years)
- Rent to cost of ownership ratio: 0.7 (PwC/ULI – U.S. average is 0.8, meaning that the average rent payment in the area is 20% lower than a mortgage payment)
- Rent as % of household income: 16.5% (PwC/ULI – U.S. average is 33.4%, meaning that the average household spends 33.4% of its income on rent, though under 30% is considered ideal)
Indianapolis Housing Market
- Median home value: $148,858 (Zillow – U.S. average is $243,225)
- Year-over-year home value growth: 6.6% (Zillow – U.S. average is 3.8%)
- 1-year projected home value growth: 4.7% (Zillow – U.S. average is 2.2%)
- Median list price per square foot: $107 (Zillow – U.S. average is $154)
- Home affordability index: 217.2 (PwC/ULI – U.S. average is 153.0, meaning a resident making the median salary can afford to buy a median-priced home in the area 1.53 times over)
Indianapolis Economy
- 5-year projected employment growth: 0.9% (PwC/ULI – U.S. average is 0.6%)
- Cost of living index: 87.7 (City Data – U.S. average is 100)
- Cost of doing business index: 93.3 (PwC/ULI – U.S. average is 100)

#6: Denver, Colorado
- Metropolitan statistical area: Denver-Aurora-Lakewood, CO
Denver Population Growth
- Population: 716,492 (Census Bureau – 2018 estimate)
- Population growth since 2017: 1.36% (Census Bureau – U.S. average is 0.62%)
- Population growth since 2010: 15.29% (Census Bureau – U.S. average is 5.96%)
- 5-year projected population growth: 1.2% (PwC/ULI – U.S. average is 0.7%)
Denver Rental Market
- Median 1-bedroom rent: $1,069 (Rentonomics – U.S. average is $961)
- Median 2-bedroom rent: $1,353 (Rentonomics – U.S. average is $1,192)
- Year-over-year rent growth: 0.8% (Rentonomics – U.S. average is 1.4%)
- Vacancy rate: 3.8% (Census Bureau – U.S. metropolitan average is 6.7%)
- Percentage of residents who rent their homes: 39.9% (Census Bureau – U.S. metropolitan average is 37.1%)
- Rent list price per square foot: $1.91 (Zillow – U.S. average is $1.14)
- Rental breakeven horizon: 2.3 years (Zillow – U.S. average is 2.0, meaning that buying is more financially advantageous than renting after 2 years)
- Rent to cost of ownership ratio: 0.5 (PwC/ULI – U.S. average is 0.8, meaning that the average rent payment in the area is 20% lower than a mortgage payment)
- Rent as % of household income: 20.2% (PwC/ULI – U.S. average is 33.4%, meaning that the average household spends 33.4% of its income on rent, though under 30% is considered ideal)
Denver Housing Market
- Median home value: $449,044 (Zillow – U.S. average is $243,225)
- Year-over-year home value growth: 0.2% (Zillow – U.S. average is 3.8%)
- 1-year projected home value growth: -0.5% (Zillow – U.S. average is 2.2%)
- Median list price per square foot: $373 (Zillow – U.S. average is $154)
- Home affordability index: 111.2 (PwC/ULI – U.S. average is 153.0, meaning a resident making the median salary can afford to buy a median-priced home in the area 1.53 times over)
Denver Economy
- 5-year projected employment growth: 1.1% (PwC/ULI – U.S. average is 0.6%)
- Cost of living index: 113.2 (City Data – U.S. average is 100)
- Cost of doing business index: 107.7 (PwC/ULI – U.S. average is 100)

#7: Jacksonville, Florida
- Metropolitan statistical area: Jacksonville, FL
Jacksonville Population Growth
- Population: 903,889 (Census Bureau – 2018 estimate)
- Population growth since 2017: 1.98% (Census Bureau – U.S. average is 0.62%)
- Population growth since 2010: 14.05% (Census Bureau – U.S. average is 5.96%)
- 5-year projected population growth: 1.3% (PwC/ULI – U.S. average is 0.7%)
Jacksonville Rental Market
- Median 1-bedroom rent: $894 (Rentonomics – U.S. average is $961)
- Median 2-bedroom rent: $1,095 (Rentonomics – U.S. average is $1,192)
- Year-over-year rent growth: 1.3% (Rentonomics – U.S. average is 1.4%)
- Vacancy rate: 5.6% (Census Bureau – U.S. metropolitan average is 6.7%)
- Percentage of residents who rent their homes: 38.6% (Census Bureau – U.S. metropolitan average is 37.1%)
- Rent list price per square foot: $0.92 (Zillow – U.S. average is $1.14)
- Rental breakeven horizon: 1.6 years (Zillow – U.S. average is 2.0, meaning that buying is more financially advantageous than renting after 2 years)
- Rent to cost of ownership ratio: 0.7 (PwC/ULI – U.S. average is 0.8, meaning that the average rent payment in the area is 20% lower than a mortgage payment)
- Rent as % of household income: 19.9% (PwC/ULI – U.S. average is 33.4%, meaning that the average household spends 33.4% of its income on rent, though under 30% is considered ideal)
Jacksonville Housing Market
- Median home value: $190,108 (Zillow – U.S. average is $243,225)
- Year-over-year home value growth: 4.1% (Zillow – U.S. average is 3.8%)
- 1-year projected home value growth: 1.5% (Zillow – U.S. average is 2.2%)
- Median list price per square foot: $125 (Zillow – U.S. average is $154)
- Home affordability index: 158.5 (PwC/ULI – U.S. average is 153.0, meaning a resident making the median salary can afford to buy a median-priced home in the area 1.53 times over)
Jacksonville Economy
- 5-year projected employment growth: 1.3% (PwC/ULI – U.S. average is 0.6%)
- Cost of living index: 87.8 (City Data – U.S. average is 100)
- Cost of doing business index: 98.6 (PwC/ULI – U.S. average is 100)

#8: Raleigh, North Carolina
- Metropolitan statistical area: Raleigh-Cary, NC
Raleigh Population Growth
- Population: 469,298 (Census Bureau – 2018 estimate)
- Population growth since 2017: 2.11% (Census Bureau – U.S. average is 0.62%)
- Population growth since 2010: 20.53% (Census Bureau – U.S. average is 5.96%)
- 5-year projected population growth: 1.3% (PwC/ULI – U.S. average is 0.7%)
Raleigh Rental Market
- Median 1-bedroom rent: $1,006 (Rentonomics – U.S. average is $961)
- Median 2-bedroom rent: $1,162 (Rentonomics – U.S. average is $1,192)
- Year-over-year rent growth: 2.1% (Rentonomics – U.S. average is 1.4%)
- Vacancy rate: 6.4% (Census Bureau – U.S. metropolitan average is 6.7%)
- Percentage of residents who rent their homes: 35.1% (Census Bureau – U.S. metropolitan average is 37.1%)
- Rent list price per square foot: $0.96 (Zillow – U.S. average is $1.14)
- Rental breakeven horizon: 2.1 years (Zillow – U.S. average is 2.0, meaning that buying is more financially advantageous than renting after 2 years)
- Rent to cost of ownership ratio: 0.7 (PwC/ULI – U.S. average is 0.8, meaning that the average rent payment in the area is 20% lower than a mortgage payment)
- Rent as % of household income: 20.0% (PwC/ULI – U.S. average is 33.4%, meaning that the average household spends 33.4% of its income on rent, though under 30% is considered ideal)
Raleigh Housing Market
- Median home value: $283,278 (Zillow – U.S. average is $243,225)
- Year-over-year home value growth: 4.4% (Zillow – U.S. average is 3.8%)
- 1-year projected home value growth: 3.4% (Zillow – U.S. average is 2.2%)
- Median list price per square foot: $156 (Zillow – U.S. average is $154)
- Home affordability index: 161.9 (PwC/ULI – U.S. average is 153.0, meaning a resident making the median salary can afford to buy a median-priced home in the area 1.53 times over)
Raleigh Economy
- 5-year projected employment growth: 1.3% (PwC/ULI – U.S. average is 0.6%)
- Cost of living index: 94.6 (City Data – U.S. average is 100)
- Cost of doing business index: 97.0 (PwC/ULI – U.S. average is 100)

#9: Portland, Oregon
- Metropolitan statistical area: Portland-Vancouver-Hillsboro, OR-WA
Portland, OR Population Growth
- Population: 653,115 (Census Bureau – 2018 estimate)
- Population growth since 2017: 0.91% (Census Bureau – U.S. average is 0.62%)
- Population growth since 2010: 11.36% (Census Bureau – U.S. average is 5.96%)
- 5-year projected population growth: 1.0% (PwC/ULI – U.S. average is 0.7%)
Portland, OR Rental Market
- Median 1-bedroom rent: $1,122 (Rentonomics – U.S. average is $961)
- Median 2-bedroom rent: $1,324 (Rentonomics – U.S. average is $1,192)
- Year-over-year rent growth: 0.4% (Rentonomics – U.S. average is 1.4%)
- Vacancy rate: 3.8% (Census Bureau – U.S. metropolitan average is 6.7%)
- Percentage of residents who rent their homes: 40.8% (Census Bureau – U.S. metropolitan average is 37.1%)
- Rent list price per square foot: $1.58 (Zillow – U.S. average is $1.14)
- Rental breakeven horizon: 4.1 years (Zillow – U.S. average is 2.0, meaning that buying is more financially advantageous than renting after 2 years)
- Rent to cost of ownership ratio: 0.5 (PwC/ULI – U.S. average is 0.8, meaning that the average rent payment in the area is 20% lower than a mortgage payment)
- Rent as % of household income: 20.5% (PwC/ULI – U.S. average is 33.4%, meaning that the average household spends 33.4% of its income on rent, though under 30% is considered ideal)
Portland, OR Housing Market
- Median home value: $452,473 (Zillow – U.S. average is $243,225)
- Year-over-year home value growth: 0.7% (Zillow – U.S. average is 3.8%)
- 1-year projected home value growth: 2.7% (Zillow – U.S. average is 2.2%)
- Median list price per square foot: $291 (Zillow – U.S. average is $154)
- Home affordability index: 106.5 (PwC/ULI – U.S. average is 153.0, meaning a resident making the median salary can afford to buy a median-priced home in the area 1.53 times over)
Portland, OR Economy
- 5-year projected employment growth: 0.9% (PwC/ULI – U.S. average is 0.6%)
- Cost of living index: 106.6 (City Data – U.S. average is 100)
- Cost of doing business index: 103.0 (PwC/ULI – U.S. average is 100)

#10: Fort Worth, Texas
- Metropolitan statistical area: Dallas-Fort Worth-Arlington, TX
Fort Worth Population Growth
- Population: 895,008 (Census Bureau – 2018 estimate)
- Population growth since 2017: 1.66% (Census Bureau – U.S. average is 0.62%)
- Population growth since 2010: 15.26% (Census Bureau – U.S. average is 5.96%)
- 5-year projected population growth: 1.6% (PwC/ULI – U.S. average is 0.7%)
Fort Worth Rental Market
- Median 1-bedroom rent: $927 (Rentonomics – U.S. average is $961)
- Median 2-bedroom rent: $1,152 (Rentonomics – U.S. average is $1,192)
- Year-over-year rent growth: 0.3% (Rentonomics – U.S. average is 1.4%)
- Vacancy rate: 7.4% (Census Bureau – U.S. metropolitan average is 6.7%)
- Percentage of residents who rent their homes: 38.0% (Census Bureau – U.S. metropolitan average is 37.1%)
- Rent list price per square foot: $0.97 (Zillow – U.S. average is $1.14)
- Rental breakeven horizon: 1.4 years (Zillow – U.S. average is 2.0, meaning that buying is more financially advantageous than renting after 2 years)
- Rent to cost of ownership ratio: 0.6 (PwC/ULI – U.S. average is 0.8, meaning that the average rent payment in the area is 20% lower than a mortgage payment)
- Rent as % of household income: 18.2% (PwC/ULI – U.S. average is 33.4%, meaning that the average household spends 33.4% of its income on rent, though under 30% is considered ideal)
Fort Worth Housing Market
- Median home value: $206,558 (Zillow – U.S. average is $243,225)
- Year-over-year home value growth: 4.9% (Zillow – U.S. average is 3.8%)
- 1-year projected home value growth: 2.9% (Zillow – U.S. average is 2.2%)
- Median list price per square foot: $128 (Zillow – U.S. average is $154)
- Home affordability index: 147.0 (PwC/ULI – U.S. average is 153.0, meaning a resident making the median salary can afford to buy a median-priced home in the area 1.53 times over)
Fort Worth Economy
- 5-year projected employment growth: 1.4% (PwC/ULI – U.S. average is 0.6%)
- Cost of living index: 94.3 (City Data – U.S. average is 100)
- Cost of doing business index: 99.3 (PwC/ULI – U.S. average is 100)
Take a deeper dive into the Dallas-Fort Worth real estate market, as well as other cities in the region: South Central Real Estate Market Trends

#11: Oklahoma City, Oklahoma
- Metropolitan statistical area: Oklahoma City, OK
Oklahoma City Population Growth
- Population: 649,021 (Census Bureau – 2018 estimate)
- Population growth since 2017: 0.95% (Census Bureau – U.S. average is 0.62%)
- Population growth since 2010: 11.45% (Census Bureau – U.S. average is 5.96%)
- 5-year projected population growth: 0.9% (PwC/ULI – U.S. average is 0.7%)
Oklahoma City Rental Market
- Median 1-bedroom rent: $634 (Rentonomics – U.S. average is $961)
- Median 2-bedroom rent: $812 (Rentonomics – U.S. average is $1,192)
- Year-over-year rent growth: 0.5% (Rentonomics – U.S. average is 1.4%)
- Vacancy rate: 11.8% (Census Bureau – U.S. metropolitan average is 6.7%)
- Percentage of residents who rent their homes: 35.4% (Census Bureau – U.S. metropolitan average is 37.1%)
- Rent list price per square foot: $0.84 (Zillow – U.S. average is $1.14)
- Rental breakeven horizon: 1.8 years (Zillow – U.S. average is 2.0, meaning that buying is more financially advantageous than renting after 2 years)
- Rent to cost of ownership ratio: 0.4 (PwC/ULI – U.S. average is 0.8, meaning that the average rent payment in the area is 20% lower than a mortgage payment)
- Rent as % of household income: 26.4% (PwC/ULI – U.S. average is 33.4%, meaning that the average household spends 33.4% of its income on rent, though under 30% is considered ideal)
Oklahoma City Housing Market
- Median home value: $137,998 (Zillow – U.S. average is $243,225)
- Year-over-year home value growth: 6.4% (Zillow – U.S. average is 3.8%)
- 1-year projected home value growth: 4.1% (Zillow – U.S. average is 2.2%)
- Median list price per square foot: $112 (Zillow – U.S. average is $154)
- Home affordability index: 64.9 (PwC/ULI – U.S. average is 153.0, meaning a resident making the median salary can afford to buy a median-priced home in the area 1.53 times over)
Oklahoma City Economy
- 5-year projected employment growth: 1.0% (PwC/ULI – U.S. average is 0.6%)
- Cost of living index: 85.4 (City Data – U.S. average is 100)
- Cost of doing business index: 93.5 (PwC/ULI – U.S. average is 100)

#12: Sacramento, California
- Metropolitan statistical area: Sacramento-Roseville-Folsom, CA
Sacramento Population Growth
- Population: 508,529 (Census Bureau – 2018 estimate)
- Population growth since 2017: 1.07% (Census Bureau – U.S. average is 0.62%)
- Population growth since 2010: 9.12% (Census Bureau – U.S. average is 5.96%)
- 5-year projected population growth: 1.2% (PwC/ULI – U.S. average is 0.7%)
Sacramento Rental Market
- Median 1-bedroom rent: $979 (Rentonomics – U.S. average is $961)
- Median 2-bedroom rent: $1,241 (Rentonomics – U.S. average is $1,192)
- Year-over-year rent growth: 2.3% (Rentonomics – U.S. average is 1.4%)
- Vacancy rate: 5.1% (Census Bureau – U.S. metropolitan average is 6.7%)
- Percentage of residents who rent their homes: 35.9% (Census Bureau – U.S. metropolitan average is 37.1%)
- Rent list price per square foot: $1.31 (Zillow – U.S. average is $1.14)
- Rental breakeven horizon: 1.9 years (Zillow – U.S. average is 2.0, meaning that buying is more financially advantageous than renting after 2 years)
- Rent to cost of ownership ratio: 0.5 (PwC/ULI – U.S. average is 0.8, meaning that the average rent payment in the area is 20% lower than a mortgage payment)
- Rent as % of household income: 21.7% (PwC/ULI – U.S. average is 33.4%, meaning that the average household spends 33.4% of its income on rent, though under 30% is considered ideal)
Sacramento Housing Market
- Median home value: $344,930 (Zillow – U.S. average is $243,225)
- Year-over-year home value growth: 4.7% (Zillow – U.S. average is 3.8%)
- 1-year projected home value growth: 4.5% (Zillow – U.S. average is 2.2%)
- Median list price per square foot: $235 (Zillow – U.S. average is $154)
- Home affordability index: 106.7 (PwC/ULI – U.S. average is 153.0, meaning a resident making the median salary can afford to buy a median-priced home in the area 1.53 times over)
Sacramento Economy
- 5-year projected employment growth: 1.2% (PwC/ULI – U.S. average is 0.6%)
- Cost of living index: 102.4 (City Data – U.S. average is 100)
- Cost of doing business index: 105.1 (PwC/ULI – U.S. average is 100)

#13: Durham, North Carolina
- Metropolitan statistical area: Durham-Chapel Hill, NC
Durham Population Growth
- Population: 274,291 (Census Bureau – 2018 estimate)
- Population growth since 2017: 1.57% (Census Bureau – U.S. average is 0.62%)
- Population growth since 2010: 13.57% (Census Bureau – U.S. average is 5.96%)
- 5-year projected population growth: 1.3% (PwC/ULI – U.S. average is 0.7%)
Durham Rental Market
- Rent list price per square foot: $0.96 (Zillow – U.S. average is $1.14)
- Rental breakeven horizon: 1.5 years (Zillow – U.S. average is 2.0, meaning that buying is more financially advantageous than renting after 2 years)
- Rent to cost of ownership ratio: 0.7 (PwC/ULI – U.S. average is 0.8, meaning that the average rent payment in the area is 20% lower than a mortgage payment)
- Rent as % of household income: 20.0% (PwC/ULI – U.S. average is 33.4%, meaning that the average household spends 33.4% of its income on rent, though under 30% is considered ideal)
Durham Housing Market
- Median home value: $246,630 (Zillow – U.S. average is $243,225)
- Year-over-year home value growth: 5.4% (Zillow – U.S. average is 3.8%)
- 1-year projected home value growth: 2.1% (Zillow – U.S. average is 2.2%)
- Median list price per square foot: $155 (Zillow – U.S. average is $154)
- Home affordability index: 161.9 (PwC/ULI – U.S. average is 153.0, meaning a resident making the median salary can afford to buy a median-priced home in the area 1.53 times over)
Durham Economy
- 5-year projected employment growth: 1.3% (PwC/ULI – U.S. average is 0.6%)
- Cost of living index: 93.9 (City Data – U.S. average is 100)
- Cost of doing business index: 97.0 (PwC/ULI – U.S. average is 100)

#14: Phoenix, Arizona
- Metropolitan statistical area: Phoenix-Mesa-Chandler, AZ
Phoenix Population Growth
- Population: 1,660,272 (Census Bureau – 2018 estimate)
- Population growth since 2017: 2.02% (Census Bureau – U.S. average is 0.62%)
- Population growth since 2010: 15.86% (Census Bureau – U.S. average is 5.96%)
- 5-year projected population growth: 1.5% (PwC/ULI – U.S. average is 0.7%)
Phoenix Rental Market
- Median 1-bedroom rent: $882 (Rentonomics – U.S. average is $961)
- Median 2-bedroom rent: $1,099 (Rentonomics – U.S. average is $1,192)
- Year-over-year rent growth: 3.8% (Rentonomics – U.S. average is 1.4%)
- Vacancy rate: 6.2% (Census Bureau – U.S. metropolitan average is 6.7%)
- Percentage of residents who rent their homes: 34.7% (Census Bureau – U.S. metropolitan average is 37.1%)
- Rent list price per square foot: $1.04 (Zillow – U.S. average is $1.14)
- Rental breakeven horizon: 2.3 years (Zillow – U.S. average is 2.0, meaning that buying is more financially advantageous than renting after 2 years)
- Rent to cost of ownership ratio: 0.6 (PwC/ULI – U.S. average is 0.8, meaning that the average rent payment in the area is 20% lower than a mortgage payment)
- Rent as % of household income: 19.2% (PwC/ULI – U.S. average is 33.4%, meaning that the average household spends 33.4% of its income on rent, though under 30% is considered ideal)
Phoenix Housing Market
- Median home value: $259,163 (Zillow – U.S. average is $243,225)
- Year-over-year home value growth: 6.1% (Zillow – U.S. average is 3.8%)
- 1-year projected home value growth: 3.5% (Zillow – U.S. average is 2.2%)
- Median list price per square foot: $173 (Zillow – U.S. average is $154)
- Home affordability index: 137.9 (PwC/ULI – U.S. average is 153.0, meaning a resident making the median salary can afford to buy a median-priced home in the area 1.53 times over)
Phoenix Economy
- 5-year projected employment growth: 1.5% (PwC/ULI – U.S. average is 0.6%)
- Cost of living index: 95.2 (City Data – U.S. average is 100)
- Cost of doing business index: 100.2 (PwC/ULI – U.S. average is 100)

#15: Des Moines, Iowa
- Metropolitan statistical area: Des Moines-West Des Moines, IA
Des Moines Population Growth
- Population: 216,853 (Census Bureau – 2018 estimate)
- Population growth since 2017: 1.60% (Census Bureau – U.S. average is 0.62%)
- Population growth since 2010: 15.06% (Census Bureau – U.S. average is 5.96%)
- 5-year projected population growth: 1.3% (PwC/ULI – U.S. average is 0.7%)
Des Moines Rental Market
- Median 1-bedroom rent: $657 (Rentonomics – U.S. average is $961)
- Median 2-bedroom rent: $808 (Rentonomics – U.S. average is $1,192)
- Year-over-year rent growth: -0.3% (Rentonomics – U.S. average is 1.4%)
- Rent list price per square foot: $1.07 (Zillow – U.S. average is $1.14)
- Rental breakeven horizon: 1.6 years (Zillow – U.S. average is 2.0, meaning that buying is more financially advantageous than renting after 2 years)
- Rent to cost of ownership ratio: 0.7 (PwC/ULI – U.S. average is 0.8, meaning that the average rent payment in the area is 20% lower than a mortgage payment)
- Rent as % of household income: 14.5% (PwC/ULI – U.S. average is 33.4%, meaning that the average household spends 33.4% of its income on rent, though under 30% is considered ideal)
Des Moines Housing Market
- Median home value: $146,555 (Zillow – U.S. average is $243,225)
- Year-over-year home value growth: 3.8% (Zillow – U.S. average is 3.8%)
- 1-year projected home value growth: 1.4% (Zillow – U.S. average is 2.2%)
- Median list price per square foot: $132 (Zillow – U.S. average is $154)
- Home affordability index: 191.5 (PwC/ULI – U.S. average is 153.0, meaning a resident making the median salary can afford to buy a median-priced home in the area 1.53 times over)
Des Moines Economy
- 5-year projected employment growth: 1.1% (PwC/ULI – U.S. average is 0.6%)
- Cost of living index: 89.9 (City Data – U.S. average is 100)
- Cost of doing business index: 95.1 (PwC/ULI – U.S. average is 100)

#16: Orlando, Florida
- Metropolitan statistical area: Orlando-Kissimmee-Sanford, FL
Orlando Population Growth
- Population: 285,713 (Census Bureau – 2018 estimate)
- Population growth since 2017: 2.39% (Census Bureau – U.S. average is 0.62%)
- Population growth since 2010: 20.55% (Census Bureau – U.S. average is 5.96%)
- 5-year projected population growth: 1.7% (PwC/ULI – U.S. average is 0.7%)
Orlando Rental Market
- Median 1-bedroom rent: $1,081 (Rentonomics – U.S. average is $961)
- Median 2-bedroom rent: $1,295 (Rentonomics – U.S. average is $1,192)
- Year-over-year rent growth: 1.8% (Rentonomics – U.S. average is 1.4%)
- Vacancy rate: 5.8% (Census Bureau – U.S. metropolitan average is 6.7%)
- Percentage of residents who rent their homes: 41.5% (Census Bureau – U.S. metropolitan average is 37.1%)
- Rent list price per square foot: $1.15 (Zillow – U.S. average is $1.14)
- Rental breakeven horizon: 1.5 years (Zillow – U.S. average is 2.0, meaning that buying is more financially advantageous than renting after 2 years)
- Rent to cost of ownership ratio: 0.8 (PwC/ULI – U.S. average is 0.8, meaning that the average rent payment in the area is 20% lower than a mortgage payment)
- Rent as % of household income: 25.2% (PwC/ULI – U.S. average is 33.4%, meaning that the average household spends 33.4% of its income on rent, though under 30% is considered ideal)
Orlando Housing Market
- Median home value: $247,658 (Zillow – U.S. average is $243,225)
- Year-over-year home value growth: 3.6% (Zillow – U.S. average is 3.8%)
- 1-year projected home value growth: 2.7% (Zillow – U.S. average is 2.2%)
- Median list price per square foot: $157 (Zillow – U.S. average is $154)
- Home affordability index: 134.9 (PwC/ULI – U.S. average is 153.0, meaning a resident making the median salary can afford to buy a median-priced home in the area 1.53 times over)
Orlando Economy
- 5-year projected employment growth: 1.9% (PwC/ULI – U.S. average is 0.6%)
- Cost of living index: 92.8 (City Data – U.S. average is 100)
- Cost of doing business index: 101.8 (PwC/ULI – U.S. average is 100)

#17: Richmond, Virginia
- Metropolitan statistical area: Richmond, VA
Richmond Population Growth
- Population: 228,783 (Census Bureau – 2018 estimate)
- Population growth since 2017: 1.03% (Census Bureau – U.S. average is 0.62%)
- Population growth since 2010: 8.12% (Census Bureau – U.S. average is 5.96%)
- 5-year projected population growth: 0.8% (PwC/ULI – U.S. average is 0.7%)
Richmond Rental Market
- Median 1-bedroom rent: $903 (Rentonomics – U.S. average is $961)
- Median 2-bedroom rent: $1,042 (Rentonomics – U.S. average is $1,192)
- Year-over-year rent growth: 1.0% (Rentonomics – U.S. average is 1.4%)
- Vacancy rate: 5.4% (Census Bureau – U.S. metropolitan average is 6.7%)
- Percentage of residents who rent their homes: 37.1% (Census Bureau – U.S. metropolitan average is 37.1%)
- Rent list price per square foot: $1.10 (Zillow – U.S. average is $1.14)
- Rental breakeven horizon: 2.0 years (Zillow – U.S. average is 2.0, meaning that buying is more financially advantageous than renting after 2 years)
- Rent to cost of ownership ratio: 0.5 (PwC/ULI – U.S. average is 0.8, meaning that the average rent payment in the area is 20% lower than a mortgage payment)
- Rent as % of household income: 16.3% (PwC/ULI – U.S. average is 33.4%, meaning that the average household spends 33.4% of its income on rent, though under 30% is considered ideal)
Richmond Housing Market
- Median home value: $237,536 (Zillow – U.S. average is $243,225)
- Year-over-year home value growth: 5.8% (Zillow – U.S. average is 3.8%)
- 1-year projected home value growth: 4.9% (Zillow – U.S. average is 2.2%)
- Median list price per square foot: $173 (Zillow – U.S. average is $154)
- Home affordability index: 146.9 (PwC/ULI – U.S. average is 153.0, meaning a resident making the median salary can afford to buy a median-priced home in the area 1.53 times over)
Richmond Economy
- 5-year projected employment growth: 0.7% (PwC/ULI – U.S. average is 0.6%)
- Cost of living index: 94.1 (City Data – U.S. average is 100)
- Cost of doing business index: 97.5 (PwC/ULI – U.S. average is 100)

#18: Charleston, South Carolina
- Metropolitan statistical area: Charleston-North Charleston, SC
Charleston, SC Population Growth
- Population: 136,208 (Census Bureau – 2018 estimate)
- Population growth since 2017: 1.62% (Census Bureau – U.S. average is 0.62%)
- Population growth since 2010: 18.51% (Census Bureau – U.S. average is 5.96%)
- 5-year projected population growth: 1.4% (PwC/ULI – U.S. average is 0.7%)
Charleston, SC Rental Market
- Vacancy rate: 17.0% (Census Bureau – U.S. metropolitan average is 6.7%)
- Percentage of residents who rent their homes: 31.2% (Census Bureau – U.S. metropolitan average is 37.1%)
- Rent list price per square foot: $1.46 (Zillow – U.S. average is $1.14)
- Rental breakeven horizon: 2.1 years (Zillow – U.S. average is 2.0, meaning that buying is more financially advantageous than renting after 2 years)
- Rent to cost of ownership ratio: 0.6 (PwC/ULI – U.S. average is 0.8, meaning that the average rent payment in the area is 20% lower than a mortgage payment)
- Rent as % of household income: 21.2% (PwC/ULI – U.S. average is 33.4%, meaning that the average household spends 33.4% of its income on rent, though under 30% is considered ideal)
Charleston, SC Housing Market
- Median home value: $328,806 (Zillow – U.S. average is $243,225)
- Year-over-year home value growth: 0.8% (Zillow – U.S. average is 3.8%)
- 1-year projected home value growth: 0.4% (Zillow – U.S. average is 2.2%)
- Median list price per square foot: $213 (Zillow – U.S. average is $154)
- Home affordability index: 140.1 (PwC/ULI – U.S. average is 153.0, meaning a resident making the median salary can afford to buy a median-priced home in the area 1.53 times over)
Charleston, SC Economy
- 5-year projected employment growth: 1.4% (PwC/ULI – U.S. average is 0.6%)
- Cost of living index: 95.1 (City Data – U.S. average is 100)
- Cost of doing business index: 98.4 (PwC/ULI – U.S. average is 100)
#19: Huntsville, Alabama
- Metropolitan statistical area: Huntsville, AL
- Cost of living index: 83.4 (City Data – U.S. average is 100)
Huntsville Population Growth
- Population: 197,318 (Census Bureau – 2018 estimate)
- Population growth since 2017: 1.53% (Census Bureau – U.S. average is 0.62%)
- Population growth since 2010: 10.80% (Census Bureau – U.S. average is 5.96%)
Huntsville Rental Market
- Median 1-bedroom rent: $677 (Rentonomics – U.S. average is $961)
- Median 2-bedroom rent: $814 (Rentonomics – U.S. average is $1,192)
- Year-over-year rent growth: 4.1% (Rentonomics – U.S. average is 1.4%)
- Rent list price per square foot: $0.77 (Zillow – U.S. average is $1.14)
Huntsville Housing Market
- Median home value: $169,890 (Zillow – U.S. average is $243,225)
- Year-over-year home value growth: 5.0% (Zillow – U.S. average is 3.8%)
- 1-year projected home value growth: 3.5% (Zillow – U.S. average is 2.2%)
- Median list price per square foot: $111 (Zillow – U.S. average is $154)

#20: Tampa, Florida
- Metropolitan statistical area: Tampa-St. Petersburg-Clearwater, FL
Tampa Population Growth
- Population: 392,890 (Census Bureau – 2018 estimate)
- Population growth since 2017: 1.66% (Census Bureau – U.S. average is 0.62%)
- Population growth since 2010: 12.90% (Census Bureau – U.S. average is 5.96%)
- 5-year projected population growth: 1.1% (PwC/ULI – U.S. average is 0.7%)
Tampa Rental Market
- Median 1-bedroom rent: $1,036 (Rentonomics – U.S. average is $961)
- Median 2-bedroom rent: $1,289 (Rentonomics – U.S. average is $1,192)
- Year-over-year rent growth: 2.4% (Rentonomics – U.S. average is 1.4%)
- Vacancy rate: 9.9% (Census Bureau – U.S. metropolitan average is 6.7%)
- Percentage of residents who rent their homes: 35.1% (Census Bureau – U.S. metropolitan average is 37.1%)
- Rent list price per square foot: $1.30 (Zillow – U.S. average is $1.14)
- Rental breakeven horizon: 1.3 years (Zillow – U.S. average is 2.0, meaning that buying is more financially advantageous than renting after 2 years)
- Rent to cost of ownership ratio: 0.7 (PwC/ULI – U.S. average is 0.8, meaning that the average rent payment in the area is 20% lower than a mortgage payment)
- Rent as % of household income: 24.2% (PwC/ULI – U.S. average is 33.4%, meaning that the average household spends 33.4% of its income on rent, though under 30% is considered ideal)
Tampa Housing Market
- Median home value: $242,159 (Zillow – U.S. average is $243,225)
- Year-over-year home value growth: 3.8% (Zillow – U.S. average is 3.8%)
- 1-year projected home value growth: 2.2% (Zillow – U.S. average is 2.2%)
- Median list price per square foot: $195 (Zillow – U.S. average is $154)
- Home affordability index: 148.8 (PwC/ULI – U.S. average is 153.0, meaning a resident making the median salary can afford to buy a median-priced home in the area 1.53 times over)
Tampa Economy
- 5-year projected employment growth: 1.2% (PwC/ULI – U.S. average is 0.6%)
- Cost of living index: 95.8 (City Data – U.S. average is 100)
- Cost of doing business index: 102.0 (PwC/ULI – U.S. average is 100)

#21: Grand Rapids, Michigan
- Metropolitan statistical area: Grand Rapids-Kentwood, MI
- Cost of living index: 85.6 (City Data – U.S. average is 100)
Grand Rapids Population Growth
- Population: 200,217 (Census Bureau – 2018 estimate)
- Population growth since 2017: 0.86% (Census Bureau – U.S. average is 0.62%)
- Population growth since 2010: 8.14% (Census Bureau – U.S. average is 5.96%)
Grand Rapids Rental Market
- Median 1-bedroom rent: $756 (Rentonomics – U.S. average is $961)
- Median 2-bedroom rent: $917 (Rentonomics – U.S. average is $1,192)
- Year-over-year rent growth: 0.4% (Rentonomics – U.S. average is 1.4%)
- Vacancy rate: 6.8% (Census Bureau – U.S. metropolitan average is 6.7%)
- Percentage of residents who rent their homes: 27.0% (Census Bureau – U.S. metropolitan average is 37.1%)
- Rent list price per square foot: $1.10 (Zillow – U.S. average is $1.14)
- Rental breakeven horizon: 1.2 years (Zillow – U.S. average is 2.0, meaning that buying is more financially advantageous than renting after 2 years)
Grand Rapids Housing Market
- Median home value: $177,375 (Zillow – U.S. average is $243,225)
- Year-over-year home value growth: 6.9% (Zillow – U.S. average is 3.8%)
- 1-year projected home value growth: 6.3% (Zillow – U.S. average is 2.2%)
- Median list price per square foot: $141 (Zillow – U.S. average is $154)
Take a deeper dive into the Grand Rapids real estate market, as well as other cities in the region: Great Lakes Real Estate Market Trends

#22: Columbus, Ohio
- Metropolitan statistical area: Columbus, OH
Columbus, OH Population Growth
- Population: 892,533 (Census Bureau – 2018 estimate)
- Population growth since 2017: 1.16% (Census Bureau – U.S. average is 0.62%)
- Population growth since 2010: 10.75% (Census Bureau – U.S. average is 5.96%)
- 5-year projected population growth: 0.8% (PwC/ULI – U.S. average is 0.7%)
Columbus, OH Rental Market
- Median 1-bedroom rent: $752 (Rentonomics – U.S. average is $961)
- Median 2-bedroom rent: $970 (Rentonomics – U.S. average is $1,192)
- Year-over-year rent growth: 1.8% (Rentonomics – U.S. average is 1.4%)
- Vacancy rate: 8.6% (Census Bureau – U.S. metropolitan average is 6.7%)
- Percentage of residents who rent their homes: 35.2% (Census Bureau – U.S. metropolitan average is 37.1%)
- Rent list price per square foot: $1.03 (Zillow – U.S. average is $1.14)
- Rental breakeven horizon: 1.6 years (Zillow – U.S. average is 2.0, meaning that buying is more financially advantageous than renting after 2 years)
- Rent to cost of ownership ratio: 0.7 (PwC/ULI – U.S. average is 0.8, meaning that the average rent payment in the area is 20% lower than a mortgage payment)
- Rent as % of household income: 16.3% (PwC/ULI – U.S. average is 33.4%, meaning that the average household spends 33.4% of its income on rent, though under 30% is considered ideal)
Columbus, OH Housing Market
- Median home value: $168,277 (Zillow – U.S. average is $243,225)
- Year-over-year home value growth: 7.8% (Zillow – U.S. average is 3.8%)
- 1-year projected home value growth: 4.4% (Zillow – U.S. average is 2.2%)
- Median list price per square foot: $132 (Zillow – U.S. average is $154)
- Home affordability index: 197.6 (PwC/ULI – U.S. average is 153.0, meaning a resident making the median salary can afford to buy a median-priced home in the area 1.53 times over)
Columbus, OH Economy
- 5-year projected employment growth: 0.8% (PwC/ULI – U.S. average is 0.6%)
- Cost of living index: 95.2 (City Data – U.S. average is 100)
- Cost of doing business index: 94.3 (PwC/ULI – U.S. average is 100)

#23: Nashville, Tennessee
- Metropolitan statistical area: Nashville-Davidson-Murfreesboro-Franklin, TN
Nashville Population Growth
- Population: 669,053 (Census Bureau – 2018 estimate)
- Population growth since 2017: 1.60% (Census Bureau – U.S. average is 0.62%)
- Population growth since 2010: 15.57% (Census Bureau – U.S. average is 5.96%)
- 5-year projected population growth: 1.2% (PwC/ULI – U.S. average is 0.7%)
Nashville Rental Market
- Median 1-bedroom rent: $948 (Rentonomics – U.S. average is $961)
- Median 2-bedroom rent: $1,164 (Rentonomics – U.S. average is $1,192)
- Year-over-year rent growth: 3.0% (Rentonomics – U.S. average is 1.4%)
- Vacancy rate: 7.5% (Census Bureau – U.S. metropolitan average is 6.7%)
- Percentage of residents who rent their homes: 31.7% (Census Bureau – U.S. metropolitan average is 37.1%)
- Rent list price per square foot: $1.18 (Zillow – U.S. average is $1.14)
- Rental breakeven horizon: 2.1 years (Zillow – U.S. average is 2.0, meaning that buying is more financially advantageous than renting after 2 years)
- Rent to cost of ownership ratio: 0.7 (PwC/ULI – U.S. average is 0.8, meaning that the average rent payment in the area is 20% lower than a mortgage payment)
- Rent as % of household income: 19.6% (PwC/ULI – U.S. average is 33.4%, meaning that the average household spends 33.4% of its income on rent, though under 30% is considered ideal)
Nashville Housing Market
- Median home value: $280,792 (Zillow – U.S. average is $243,225)
- Year-over-year home value growth: 3.2% (Zillow – U.S. average is 3.8%)
- 1-year projected home value growth: 2.7% (Zillow – U.S. average is 2.2%)
- Median list price per square foot: $190 (Zillow – U.S. average is $154)
- Home affordability index: 144.7 (PwC/ULI – U.S. average is 153.0, meaning a resident making the median salary can afford to buy a median-priced home in the area 1.53 times over)
Nashville Economy
- 5-year projected employment growth: 1.2% (PwC/ULI – U.S. average is 0.6%)
- Cost of living index: 90.1 (City Data – U.S. average is 100)
- Cost of doing business index: 95.4 (PwC/ULI – U.S. average is 100)
Take a deeper dive into the Nashville real estate market, as well as other cities in the region: South Central Real Estate Market Trends

#24: San Antonio, Texas
- Metropolitan statistical area: San Antonio-New Braunfels, TX
San Antonio Population Growth
- Population: 1,532,233 (Census Bureau – 2018 estimate)
- Population growth since 2017: 1.77% (Census Bureau – U.S. average is 0.62%)
- Population growth since 2010: 17.53% (Census Bureau – U.S. average is 5.96%)
- 5-year projected population growth: 1.6% (PwC/ULI – U.S. average is 0.7%)
San Antonio Rental Market
- Median 1-bedroom rent: $861 (Rentonomics – U.S. average is $961)
- Median 2-bedroom rent: $1,082 (Rentonomics – U.S. average is $1,192)
- Year-over-year rent growth: 1.8% (Rentonomics – U.S. average is 1.4%)
- Vacancy rate: 7.4% (Census Bureau – U.S. metropolitan average is 6.7%)
- Percentage of residents who rent their homes: 35.6% (Census Bureau – U.S. metropolitan average is 37.1%)
- Rent list price per square foot: $0.88 (Zillow – U.S. average is $1.14)
- Rental breakeven horizon: 2.1 years (Zillow – U.S. average is 2.0, meaning that buying is more financially advantageous than renting after 2 years)
- Rent to cost of ownership ratio: 0.6 (PwC/ULI – U.S. average is 0.8, meaning that the average rent payment in the area is 20% lower than a mortgage payment)
- Rent as % of household income: 18.3% (PwC/ULI – U.S. average is 33.4%, meaning that the average household spends 33.4% of its income on rent, though under 30% is considered ideal)
San Antonio Housing Market
- Median home value: $184,384 (Zillow – U.S. average is $243,225)
- Year-over-year home value growth: 5.6% (Zillow – U.S. average is 3.8%)
- 1-year projected home value growth: 2.9% (Zillow – U.S. average is 2.2%)
- Median list price per square foot: $123 (Zillow – U.S. average is $154)
- Home affordability index: 152.7 (PwC/ULI – U.S. average is 153.0, meaning a resident making the median salary can afford to buy a median-priced home in the area 1.53 times over)
San Antonio Economy
- 5-year projected employment growth: 1.5% (PwC/ULI – U.S. average is 0.6%)
- Cost of living index: 87.2 (City Data – U.S. average is 100)
- Cost of doing business index: 94.5 (PwC/ULI – U.S. average is 100)
Take a deeper dive into the San Antonio real estate market, as well as other cities in the region: South Central Real Estate Market Trends

#25: Virginia Beach, Virginia
- Metropolitan statistical area: Virginia Beach-Norfolk-Newport News, VA-NC
Virginia Beach Population Growth
- Population: 450,189 (Census Bureau – 2018 estimate)
- Population growth since 2017: 0.22% (Census Bureau – U.S. average is 0.62%)
- Population growth since 2010: 3.10% (Census Bureau – U.S. average is 5.96%)
- 5-year projected population growth: 0.6% (PwC/ULI – U.S. average is 0.7%)
Virginia Beach Rental Market
- Median 1-bedroom rent: $1,090 (Rentonomics – U.S. average is $961)
- Median 2-bedroom rent: $1,311 (Rentonomics – U.S. average is $1,192)
- Year-over-year rent growth: 1.6% (Rentonomics – U.S. average is 1.4%)
- Vacancy rate: 7.1% (Census Bureau – U.S. metropolitan average is 6.7%)
- Percentage of residents who rent their homes: 37.2% (Census Bureau – U.S. metropolitan average is 37.1%)
- Rent list price per square foot: $1.02 (Zillow – U.S. average is $1.14)
- Rental breakeven horizon: 3.4 years (Zillow – U.S. average is 2.0, meaning that buying is more financially advantageous than renting after 2 years)
- Rent to cost of ownership ratio: 0.6 (PwC/ULI – U.S. average is 0.8, meaning that the average rent payment in the area is 20% lower than a mortgage payment)
- Rent as % of household income: 18.3% (PwC/ULI – U.S. average is 33.4%, meaning that the average household spends 33.4% of its income on rent, though under 30% is considered ideal)
Virginia Beach Housing Market
- Median home value: $278,524 (Zillow – U.S. average is $243,225)
- Year-over-year home value growth: 2.3% (Zillow – U.S. average is 3.8%)
- 1-year projected home value growth: 2.0% (Zillow – U.S. average is 2.2%)
- Median list price per square foot: $171 (Zillow – U.S. average is $154)
- Home affordability index: 149.6 (PwC/ULI – U.S. average is 153.0, meaning a resident making the median salary can afford to buy a median-priced home in the area 1.53 times over)
Virginia Beach Economy
- 5-year projected employment growth: 0.5% (PwC/ULI – U.S. average is 0.6%)
- Cost of living index: 97.3 (City Data – U.S. average is 100)
- Cost of doing business index: 99.1 (PwC/ULI – U.S. average is 100)

#26: Kansas City, Missouri
- Metropolitan statistical area: Kansas City, MO-KS
Kansas City Population Growth
- Population: 491,918 (Census Bureau – 2018 estimate)
- Population growth since 2017: 0.77% (Census Bureau – U.S. average is 0.62%)
- Population growth since 2010: 6.68% (Census Bureau – U.S. average is 5.96%)
- 5-year projected population growth: 0.7% (PwC/ULI – U.S. average is 0.7%)
Kansas City Rental Market
- Median 1-bedroom rent: $747 (Rentonomics – U.S. average is $961)
- Median 2-bedroom rent: $916 (Rentonomics – U.S. average is $1,192)
- Year-over-year rent growth: 0.7% (Rentonomics – U.S. average is 1.4%)
- Vacancy rate: 7.9% (Census Bureau – U.S. metropolitan average is 6.7%)
- Percentage of residents who rent their homes: 35.7% (Census Bureau – U.S. metropolitan average is 37.1%)
- Rent list price per square foot: $0.95 (Zillow – U.S. average is $1.14)
- Rental breakeven horizon: 1.5 years (Zillow – U.S. average is 2.0, meaning that buying is more financially advantageous than renting after 2 years)
- Rent to cost of ownership ratio: 0.7 (PwC/ULI – U.S. average is 0.8, meaning that the average rent payment in the area is 20% lower than a mortgage payment)
- Rent as % of household income: 16.3% (PwC/ULI – U.S. average is 33.4%, meaning that the average household spends 33.4% of its income on rent, though under 30% is considered ideal)
Kansas City Housing Market
- Median home value: $157,002 (Zillow – U.S. average is $243,225)
- Year-over-year home value growth: 4.4% (Zillow – U.S. average is 3.8%)
- 1-year projected home value growth: 2.3% (Zillow – U.S. average is 2.2%)
- Median list price per square foot: $134 (Zillow – U.S. average is $154)
- Home affordability index: 193.8 (PwC/ULI – U.S. average is 153.0, meaning a resident making the median salary can afford to buy a median-priced home in the area 1.53 times over)
Kansas City Economy
- 5-year projected employment growth: 0.7% (PwC/ULI – U.S. average is 0.6%)
- Cost of living index: 87.0 (City Data – U.S. average is 100)
- Cost of doing business index: 95.4 (PwC/ULI – U.S. average is 100)

#27: Salt Lake City, Utah
- Metropolitan statistical area: Salt Lake City, UT
Salt Lake City Population Growth
- Population: 200,591 (Census Bureau – 2018 estimate)
- Population growth since 2017: 1.44% (Census Bureau – U.S. average is 0.62%)
- Population growth since 2010: 12.39% (Census Bureau – U.S. average is 5.96%)
- 5-year projected population growth: 1.3% (PwC/ULI – U.S. average is 0.7%)
Salt Lake City Rental Market
- Median 1-bedroom rent: $878 (Rentonomics – U.S. average is $961)
- Median 2-bedroom rent: $1,089 (Rentonomics – U.S. average is $1,192)
- Year-over-year rent growth: 1.4% (Rentonomics – U.S. average is 1.4%)
- Vacancy rate: 6.1% (Census Bureau – U.S. metropolitan average is 6.7%)
- Percentage of residents who rent their homes: 30.5% (Census Bureau – U.S. metropolitan average is 37.1%)
- Rent list price per square foot: $1.47 (Zillow – U.S. average is $1.14)
- Rental breakeven horizon: 2.4 years (Zillow – U.S. average is 2.0, meaning that buying is more financially advantageous than renting after 2 years)
- Rent to cost of ownership ratio: 0.5 (PwC/ULI – U.S. average is 0.8, meaning that the average rent payment in the area is 20% lower than a mortgage payment)
- Rent as % of household income: 15.7% (PwC/ULI – U.S. average is 33.4%, meaning that the average household spends 33.4% of its income on rent, though under 30% is considered ideal)
Salt Lake City Housing Market
- Median home value: $402,581 (Zillow – U.S. average is $243,225)
- Year-over-year home value growth: 6.6% (Zillow – U.S. average is 3.8%)
- 1-year projected home value growth: 1.0% (Zillow – U.S. average is 2.2%)
- Median list price per square foot: $324 (Zillow – U.S. average is $154)
- Home affordability index: 132.5 (PwC/ULI – U.S. average is 153.0, meaning a resident making the median salary can afford to buy a median-priced home in the area 1.53 times over)
Salt Lake City Economy
- 5-year projected employment growth: 1.2% (PwC/ULI – U.S. average is 0.6%)
- Cost of living index: 92.9 (City Data – U.S. average is 100)
- Cost of doing business index: 99.3 (PwC/ULI – U.S. average is 100)

#28: Cincinnati, Ohio
- Metropolitan statistical area: Cincinnati, OH-KY-IN
Cincinnati Population Growth
- Population: 302,605 (Census Bureau – 2018 estimate)
- Population growth since 2017: 0.47% (Census Bureau – U.S. average is 0.62%)
- Population growth since 2010: 3.57% (Census Bureau – U.S. average is 5.96%)
- 5-year projected population growth: 0.3% (PwC/ULI – U.S. average is 0.7%)
Cincinnati Rental Market
- Median 1-bedroom rent: $651 (Rentonomics – U.S. average is $961)
- Median 2-bedroom rent: $855 (Rentonomics – U.S. average is $1,192)
- Year-over-year rent growth: 0.8% (Rentonomics – U.S. average is 1.4%)
- Vacancy rate: 4.4% (Census Bureau – U.S. metropolitan average is 6.7%)
- Percentage of residents who rent their homes: 32.7% (Census Bureau – U.S. metropolitan average is 37.1%)
- Rent list price per square foot: $1.19 (Zillow – U.S. average is $1.14)
- Rental breakeven horizon: 1.5 years (Zillow – U.S. average is 2.0, meaning that buying is more financially advantageous than renting after 2 years)
- Rent to cost of ownership ratio: 0.8 (PwC/ULI – U.S. average is 0.8, meaning that the average rent payment in the area is 20% lower than a mortgage payment)
- Rent as % of household income: 16.4% (PwC/ULI – U.S. average is 33.4%, meaning that the average household spends 33.4% of its income on rent, though under 30% is considered ideal)
Cincinnati Housing Market
- Median home value: $161,508 (Zillow – U.S. average is $243,225)
- Year-over-year home value growth: 7.0% (Zillow – U.S. average is 3.8%)
- 1-year projected home value growth: 3.8% (Zillow – U.S. average is 2.2%)
- Median list price per square foot: $125 (Zillow – U.S. average is $154)
- Home affordability index: 232.5 (PwC/ULI – U.S. average is 153.0, meaning a resident making the median salary can afford to buy a median-priced home in the area 1.53 times over)
Cincinnati Economy
- 5-year projected employment growth: 0.3% (PwC/ULI – U.S. average is 0.6%)
- Cost of living index: 88.7 (City Data – U.S. average is 100)
- Cost of doing business index: 92.2 (PwC/ULI – U.S. average is 100)

#29: Las Vegas, Nevada
- Metropolitan statistical area: Las Vegas-Henderson-Paradise, NV
Las Vegas Population Growth
- Population: 644,644 (Census Bureau – 2018 estimate)
- Population growth since 2017: 2.21% (Census Bureau – U.S. average is 0.62%)
- Population growth since 2010: 14.37% (Census Bureau – U.S. average is 5.96%)
- 5-year projected population growth: 1.4% (PwC/ULI – U.S. average is 0.7%)
Las Vegas Rental Market
- Median 1-bedroom rent: $962 (Rentonomics – U.S. average is $961)
- Median 2-bedroom rent: $1,193 (Rentonomics – U.S. average is $1,192)
- Year-over-year rent growth: 3.2% (Rentonomics – U.S. average is 1.4%)
- Vacancy rate: 6.8% (Census Bureau – U.S. metropolitan average is 6.7%)
- Percentage of residents who rent their homes: 41.9% (Census Bureau – U.S. metropolitan average is 37.1%)
- Rent list price per square foot: $0.97 (Zillow – U.S. average is $1.14)
- Rental breakeven horizon: 1.8 years (Zillow – U.S. average is 2.0, meaning that buying is more financially advantageous than renting after 2 years)
- Rent to cost of ownership ratio: 0.7 (PwC/ULI – U.S. average is 0.8, meaning that the average rent payment in the area is 20% lower than a mortgage payment)
- Rent as % of household income: 22.4% (PwC/ULI – U.S. average is 33.4%, meaning that the average household spends 33.4% of its income on rent, though under 30% is considered ideal)
Las Vegas Housing Market
- Median home value: $283,539 (Zillow – U.S. average is $243,225)
- Year-over-year home value growth: 1.1% (Zillow – U.S. average is 3.8%)
- 1-year projected home value growth: 2.5% (Zillow – U.S. average is 2.2%)
- Median list price per square foot: $170 (Zillow – U.S. average is $154)
- Home affordability index: 126.1 (PwC/ULI – U.S. average is 153.0, meaning a resident making the median salary can afford to buy a median-priced home in the area 1.53 times over)
Las Vegas Economy
- 5-year projected employment growth: 1.8% (PwC/ULI – U.S. average is 0.6%)
- Cost of living index: 97.4 (City Data – U.S. average is 100)
- Cost of doing business index: 100.9 (PwC/ULI – U.S. average is 100)

#30: Milwaukee, Wisconsin
- Metropolitan statistical area: Milwaukee-Waukesha, WI
Milwaukee Population Growth
- Population: 592,025 (Census Bureau – 2018 estimate)
- Population growth since 2017: 0.06% (Census Bureau – U.S. average is 0.62%)
- Population growth since 2010: 1.30% (Census Bureau – U.S. average is 5.96%)
- 5-year projected population growth: 0% (PwC/ULI – U.S. average is 0.7%)
Milwaukee Rental Market
- Median 1-bedroom rent: $727 (Rentonomics – U.S. average is $961)
- Median 2-bedroom rent: $902 (Rentonomics – U.S. average is $1,192)
- Year-over-year rent growth: 1.0% (Rentonomics – U.S. average is 1.4%)
- Vacancy rate: 5.9% (Census Bureau – U.S. metropolitan average is 6.7%)
- Percentage of residents who rent their homes: 37.7% (Census Bureau – U.S. metropolitan average is 37.1%)
- Rent list price per square foot: $1.03 (Zillow – U.S. average is $1.14)
- Rental breakeven horizon: 1.3 years (Zillow – U.S. average is 2.0, meaning that buying is more financially advantageous than renting after 2 years)
- Rent to cost of ownership ratio: 0.6 (PwC/ULI – U.S. average is 0.8, meaning that the average rent payment in the area is 20% lower than a mortgage payment)
- Rent as % of household income: 20.2% (PwC/ULI – U.S. average is 33.4%, meaning that the average household spends 33.4% of its income on rent, though under 30% is considered ideal)
Milwaukee Housing Market
- Median home value: $130,188 (Zillow – U.S. average is $243,225)
- Year-over-year home value growth: 4.3% (Zillow – U.S. average is 3.8%)
- 1-year projected home value growth: 3.1% (Zillow – U.S. average is 2.2%)
- Median list price per square foot: $108 (Zillow – U.S. average is $154)
- Home affordability index: 153.7 (PwC/ULI – U.S. average is 153.0, meaning a resident making the median salary can afford to buy a median-priced home in the area 1.53 times over)
Milwaukee Economy
- 5-year projected employment growth: 0.3 (PwC/ULI – U.S. average is 0.6%)
- Cost of living index: 97.4 (City Data – U.S. average is 100)
- Cost of doing business index: 96.3 (PwC/ULI – U.S. average is 100)
Take a deeper dive into the Milwaukee real estate market, as well as other cities in the region: Great Lakes Real Estate Market Trends

#31: Omaha, Nebraska
- Metropolitan statistical area: Omaha-Council Bluffs, NE-IA
Omaha Population Growth
- Population: 468,262 (Census Bureau – 2018 estimate)
- Population growth since 2017: 1.07% (Census Bureau – U.S. average is 0.62%)
- Population growth since 2010: 8.88% (Census Bureau – U.S. average is 5.96%)
- 5-year projected population growth: 0.9 (PwC/ULI – U.S. average is 0.7%)
Omaha Rental Market
- Median 1-bedroom rent: $762 (Rentonomics – U.S. average is $961)
- Median 2-bedroom rent: $952 (Rentonomics – U.S. average is $1,192)
- Year-over-year rent growth: 1.2% (Rentonomics – U.S. average is 1.4%)
- Vacancy rate: 7.1% (Census Bureau – U.S. metropolitan average is 6.7%)
- Percentage of residents who rent their homes: 32.2% (Census Bureau – U.S. metropolitan average is 37.1%)
- Rent list price per square foot: $1.10 (Zillow – U.S. average is $1.14)
- Rental breakeven horizon: 1.8 years (Zillow – U.S. average is 2.0, meaning that buying is more financially advantageous than renting after 2 years)
- Rent to cost of ownership ratio: 0.7 (PwC/ULI – U.S. average is 0.8, meaning that the average rent payment in the area is 20% lower than a mortgage payment)
- Rent as % of household income: 15.6% (PwC/ULI – U.S. average is 33.4%, meaning that the average household spends 33.4% of its income on rent, though under 30% is considered ideal)
Omaha Housing Market
- Median home value: $190,705 (Zillow – U.S. average is $243,225)
- Year-over-year home value growth: 5.7% (Zillow – U.S. average is 3.8%)
- 1-year projected home value growth: 4.3% (Zillow – U.S. average is 2.2%)
- Median list price per square foot: $149 (Zillow – U.S. average is $154)
- Home affordability index: 207.4 (PwC/ULI – U.S. average is 153.0, meaning a resident making the median salary can afford to buy a median-priced home in the area 1.53 times over)
Omaha Economy
- 5-year projected employment growth: 0.6 (PwC/ULI – U.S. average is 0.6%)
- Cost of living index: 89.3 (City Data – U.S. average is 100)
- Cost of doing business index: 95.1 (PwC/ULI – U.S. average is 100)

#32: Fort Wayne, Indiana
- Metropolitan statistical area: Fort Wayne, IN
- Cost of living index: 82.6 (City Data – U.S. average is 100)
Fort Wayne Population Growth
- Population: 267,633 (Census Bureau – 2018 estimate)
- Population growth since 2017: 0.84% (Census Bureau – U.S. average is 0.62%)
- Population growth since 2010: 5.13% (Census Bureau – U.S. average is 5.96%)
Fort Wayne Rental Market
- Median 1-bedroom rent: $613 (Rentonomics – U.S. average is $961)
- Median 2-bedroom rent: $779 (Rentonomics – U.S. average is $1,192)
- Year-over-year rent growth: 2.1% (Rentonomics – U.S. average is 1.4%)
- Rent list price per square foot: $0.76 (Zillow – U.S. average is $1.14)
- Rental breakeven horizon: 1.5 years (Zillow – U.S. average is 2.0, meaning that buying is more financially advantageous than renting after 2 years)
Fort Wayne Housing Market
- Median home value: $142,963 (Zillow – U.S. average is $243,225)
- Year-over-year home value growth: 8.7% (Zillow – U.S. average is 3.8%)
- 1-year projected home value growth: 5.0% (Zillow – U.S. average is 2.2%)
- Median list price per square foot: $98 (Zillow – U.S. average is $154)

#33: Atlanta, Georgia
- Metropolitan statistical area: Atlanta-Sandy Springs-Roswell, GA
Atlanta Population Growth
- Population: 498,044 (Census Bureau – 2018 estimate)
- Population growth since 2017: 1.29% (Census Bureau – U.S. average is 0.62%)
- Population growth since 2010: 12.54% (Census Bureau – U.S. average is 5.96%)
- 5-year projected population growth: 1.2% (PwC/ULI – U.S. average is 0.7%)
Atlanta Rental Market
- Median 1-bedroom rent: $1,039 (Rentonomics – U.S. average is $961)
- Median 2-bedroom rent: $1,200 (Rentonomics – U.S. average is $1,192)
- Year-over-year rent growth: 1.0% (Rentonomics – U.S. average is 1.4%)
- Vacancy rate: 6.6% (Census Bureau – U.S. metropolitan average is 6.7%)
- Percentage of residents who rent their homes: 36.0% (Census Bureau – U.S. metropolitan average is 37.1%)
- Rent list price per square foot: $1.53 (Zillow – U.S. average is $1.14)
- Rental breakeven horizon: 1.4 years (Zillow – U.S. average is 2.0, meaning that buying is more financially advantageous than renting after 2 years)
- Rent to cost of ownership ratio: 0.9 (PwC/ULI – U.S. average is 0.8, meaning that the average rent payment in the area is 20% lower than a mortgage payment)
- Rent as % of household income: 21.0% (PwC/ULI – U.S. average is 33.4%, meaning that the average household spends 33.4% of its income on rent, though under 30% is considered ideal)
Atlanta Housing Market
- Median home value: $287,054 (Zillow – U.S. average is $243,225)
- Year-over-year home value growth: 2.3% (Zillow – U.S. average is 3.8%)
- 1-year projected home value growth: 1.0% (Zillow – U.S. average is 2.2%)
- Median list price per square foot: $234 (Zillow – U.S. average is $154)
- Home affordability index: 179.4 (PwC/ULI – U.S. average is 153.0, meaning a resident making the median salary can afford to buy a median-priced home in the area 1.53 times over)
Atlanta Economy
- 5-year projected employment growth: 1.1% (PwC/ULI – U.S. average is 0.6%)
- Cost of living index: 99.1 (City Data – U.S. average is 100)
- Cost of doing business index: 97.0 (PwC/ULI – U.S. average is 100)

#34: Tucson, Arizona
- Metropolitan statistical area: Tucson, AZ
Tucson Population Growth
- Population: 545,975 (Census Bureau – 2018 estimate)
- Population growth since 2017: 1.13% (Census Bureau – U.S. average is 0.62%)
- Population growth since 2010: 6.0% (Census Bureau – U.S. average is 5.96%)
- 5-year projected population growth: 0.7% (PwC/ULI – U.S. average is 0.7%)
Tucson Rental Market
- Median 1-bedroom rent: $715 (Rentonomics – U.S. average is $961)
- Median 2-bedroom rent: $950 (Rentonomics – U.S. average is $1,192)
- Year-over-year rent growth: 1.8% (Rentonomics – U.S. average is 1.4%)
- Vacancy rate: 4.4% (Census Bureau – U.S. metropolitan average is 6.7%)
- Percentage of residents who rent their homes: 36.2% (Census Bureau – U.S. metropolitan average is 37.1%)
- Rent list price per square foot: $0.96 (Zillow – U.S. average is $1.14)
- Rental breakeven horizon: 2.1 years (Zillow – U.S. average is 2.0, meaning that buying is more financially advantageous than renting after 2 years)
- Rent to cost of ownership ratio: 0.5 (PwC/ULI – U.S. average is 0.8, meaning that the average rent payment in the area is 20% lower than a mortgage payment)
- Rent as % of household income: 17.1% (PwC/ULI – U.S. average is 33.4%, meaning that the average household spends 33.4% of its income on rent, though under 30% is considered ideal)
Tucson Housing Market
- Median home value: $210,141 (Zillow – U.S. average is $243,225)
- Year-over-year home value growth: 6.1% (Zillow – U.S. average is 3.8%)
- 1-year projected home value growth: 4.8% (Zillow – U.S. average is 2.2%)
- Median list price per square foot: $141 (Zillow – U.S. average is $154)
- Home affordability index: 134.6 (PwC/ULI – U.S. average is 153.0, meaning a resident making the median salary can afford to buy a median-priced home in the area 1.53 times over)
Tucson Economy
- 5-year projected employment growth: 0.9% (PwC/ULI – U.S. average is 0.6%)
- Cost of living index: 89.2 (City Data – U.S. average is 100)
- Cost of doing business index: 97.4 (PwC/ULI – U.S. average is 100)

#35: Arlington, Texas
- Metropolitan statistical area: Dallas-Fort Worth-Arlington, TX
- Cost of living index: 94.5 (City Data – U.S. average is 100)
Arlington, TX Population Growth
- Population: 398,112 (Census Bureau – 2018 estimate)
- Population growth since 2017: 1.66% (Census Bureau – U.S. average is 0.62%)
- Population growth since 2010: 15.26% (Census Bureau – U.S. average is 5.96%)
Arlington, TX Rental Market
- Median 1-bedroom rent: $1,014 (Rentonomics – U.S. average is $961)
- Median 2-bedroom rent: $1,261 (Rentonomics – U.S. average is $1,192)
- Year-over-year rent growth: 2.2% (Rentonomics – U.S. average is 1.4%)
- Vacancy rate: 7.4% (Census Bureau – U.S. metropolitan average is 6.7%)
- Percentage of residents who rent their homes: 38.0% (Census Bureau – U.S. metropolitan average is 37.1%)
- Rent list price per square foot: $0.98 (Zillow – U.S. average is $1.14)
- Rental breakeven horizon: 1.5 years (Zillow – U.S. average is 2.0, meaning that buying is more financially advantageous than renting after 2 years)
Arlington, TX Housing Market
- Median home value: $216,210 (Zillow – U.S. average is $243,225)
- Year-over-year home value growth: 5.5% (Zillow – U.S. average is 3.8%)
- 1-year projected home value growth: 3.5% (Zillow – U.S. average is 2.2%)
- Median list price per square foot: $126 (Zillow – U.S. average is $154)
Take a deeper dive into the Dallas-Fort Worth real estate market, as well as other cities in the region: South Central Real Estate Market Trends

#36: Colorado Springs, Colorado
- Metropolitan statistical area: Colorado Springs, CO
- Cost of living index: 98.3 (City Data – U.S. average is 100)
Colorado Springs Population Growth
- Population: 472,688 (Census Bureau – 2018 estimate)
- Population growth since 2017: 1.86% (Census Bureau – U.S. average is 0.62%)
- Population growth since 2010: 14.46% (Census Bureau – U.S. average is 5.96%)
Colorado Springs Rental Market
- Median 1-bedroom rent: $986 (Rentonomics – U.S. average is $961)
- Median 2-bedroom rent: $1,272 (Rentonomics – U.S. average is $1,192)
- Year-over-year rent growth: 3.4% (Rentonomics – U.S. average is 1.4%)
- Rent list price per square foot: $1.59 (Zillow – U.S. average is $1.14)
- Rental breakeven horizon: 2.2 years (Zillow – U.S. average is 2.0, meaning that buying is more financially advantageous than renting after 2 years)
Colorado Springs Housing Market
- Median home value: $311,380 (Zillow – U.S. average is $243,225)
- Year-over-year home value growth: 6.5% (Zillow – U.S. average is 3.8%)
- 1-year projected home value growth: 4.3% (Zillow – U.S. average is 2.2%)
- Median list price per square foot: $279 (Zillow – U.S. average is $154)

#37: Tacoma, Washington
- Metropolitan statistical area: Seattle-Tacoma-Bellevue, WA
Tacoma Population Growth
- Population: 216,279 (Census Bureau – 2018 estimate)
- Population growth since 2017: 1.61% (Census Bureau – U.S. average is 0.62%)
- Population growth since 2010: 12.08% (Census Bureau – U.S. average is 5.96%)
- 5-year projected population growth: 1.2% (PwC/ULI – U.S. average is 0.7%)
Tacoma Rental Market
- Median 1-bedroom rent: $1,257 (Rentonomics – U.S. average is $961)
- Median 2-bedroom rent: $1,566 (Rentonomics – U.S. average is $1,192)
- Year-over-year rent growth: 1.4% (Rentonomics – U.S. average is 1.4%)
- Vacancy rate: 4.8% (Census Bureau – U.S. metropolitan average is 6.7%)
- Percentage of residents who rent their homes: 37.5% (Census Bureau – U.S. metropolitan average is 37.1%)
- Rent list price per square foot: $1.45 (Zillow – U.S. average is $1.14)
- Rental breakeven horizon: 1.4 years (Zillow – U.S. average is 2.0, meaning that buying is more financially advantageous than renting after 2 years)
- Rent to cost of ownership ratio: 0.5 (PwC/ULI – U.S. average is 0.8, meaning that the average rent payment in the area is 20% lower than a mortgage payment)
- Rent as % of household income: 18.3% (PwC/ULI – U.S. average is 33.4%, meaning that the average household spends 33.4% of its income on rent, though under 30% is considered ideal)
Tacoma Housing Market
- Median home value: $335,424 (Zillow – U.S. average is $243,225)
- Year-over-year home value growth: 7.7% (Zillow – U.S. average is 3.8%)
- 1-year projected home value growth: 5.1% (Zillow – U.S. average is 2.2%)
- Median list price per square foot: $239 (Zillow – U.S. average is $154)
- Home affordability index: 113.0 (PwC/ULI – U.S. average is 153.0, meaning a resident making the median salary can afford to buy a median-priced home in the area 1.53 times over)
Tacoma Economy
- 5-year projected employment growth: 0.9% (PwC/ULI – U.S. average is 0.6%)
- Cost of living index: 113.5 (City Data – U.S. average is 100)
- Cost of doing business index: 110.0 (PwC/ULI – U.S. average is 100)

#38: Minneapolis, Minnesota
- Metropolitan statistical area: Minneapolis-St. Paul-Bloomington, MN-WI
Minneapolis Population Growth
- Population: 425,403 (Census Bureau – 2018 estimate)
- Population growth since 2017: 1.02% (Census Bureau – U.S. average is 0.62%)
- Population growth since 2010: 8.37% (Census Bureau – U.S. average is 5.96%)
- 5-year projected population growth: 0.7% (PwC/ULI – U.S. average is 0.7%)
Minneapolis Rental Market
- Median 1-bedroom rent: $912 (Rentonomics – U.S. average is $961)
- Median 2-bedroom rent: $1,150 (Rentonomics – U.S. average is $1,192)
- Year-over-year rent growth: 1.2% (Rentonomics – U.S. average is 1.4%)
- Vacancy rate: 4.1% (Census Bureau – U.S. metropolitan average is 6.7%)
- Percentage of residents who rent their homes: 32.2% (Census Bureau – U.S. metropolitan average is 37.1%)
- Rent list price per square foot: $1.69 (Zillow – U.S. average is $1.14)
- Rental breakeven horizon: 1.6 years (Zillow – U.S. average is 2.0, meaning that buying is more financially advantageous than renting after 2 years)
- Rent to cost of ownership ratio: 0.7 (PwC/ULI – U.S. average is 0.8, meaning that the average rent payment in the area is 20% lower than a mortgage payment)
- Rent as % of household income: 19.0% (PwC/ULI – U.S. average is 33.4%, meaning that the average household spends 33.4% of its income on rent, though under 30% is considered ideal)
Minneapolis Housing Market
- Median home value: $282,727 (Zillow – U.S. average is $243,225)
- Year-over-year home value growth: 3.0% (Zillow – U.S. average is 3.8%)
- 1-year projected home value growth: 3.4% (Zillow – U.S. average is 2.2%)
- Median list price per square foot: $259 (Zillow – U.S. average is $154)
- Home affordability index: 166.9 (PwC/ULI – U.S. average is 153.0, meaning a resident making the median salary can afford to buy a median-priced home in the area 1.53 times over)
Minneapolis Economy
- 5-year projected employment growth: 0.7% (PwC/ULI – U.S. average is 0.6%)
- Cost of living index: 114.4 (City Data – U.S. average is 100)
- Cost of doing business index: 102.7 (PwC/ULI – U.S. average is 100)
Take a deeper dive into the Minneapolis real estate market, as well as other cities in the region: Great Lakes Real Estate Market Trends
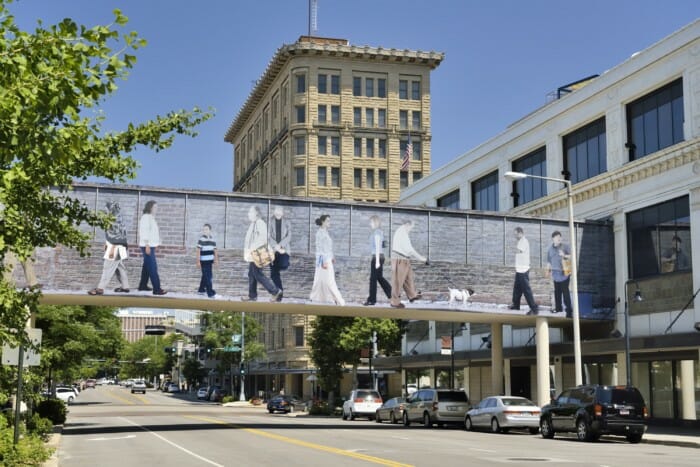
#39: Lincoln, Nebraska
- Metropolitan statistical area: Lincoln, NE
- Cost of living index: 84.3 (City Data – U.S. average is 100)
Lincoln Population Growth
- Population: 287,401 (Census Bureau – 2018 estimate)
- Population growth since 2017: 1.03% (Census Bureau – U.S. average is 0.62%)
- Population growth since 2010: 10.73% (Census Bureau – U.S. average is 5.96%)
Lincoln Rental Market
- Median 1-bedroom rent: $678 (Rentonomics – U.S. average is $961)
- Median 2-bedroom rent: $883 (Rentonomics – U.S. average is $1,192)
- Year-over-year rent growth: 0.3% (Rentonomics – U.S. average is 1.4%)
- Rent list price per square foot: $1.04 (Zillow – U.S. average is $1.14)
- Rental breakeven horizon: 2.2 years (Zillow – U.S. average is 2.0, meaning that buying is more financially advantageous than renting after 2 years)
Lincoln Housing Market
- Median home value: $193,998 (Zillow – U.S. average is $243,225)
- Year-over-year home value growth: 3.2% (Zillow – U.S. average is 3.8%)
- 1-year projected home value growth: 2.4% (Zillow – U.S. average is 2.2%)
- Median list price per square foot: $155 (Zillow – U.S. average is $154)

#40: Pittsburgh, Pennsylvania
- Metropolitan statistical area: Pittsburgh, PA
Pittsburgh Population Growth
- Population: 301,048 (Census Bureau – 2018 estimate)
- Population growth since 2017: -0.24% (Census Bureau – U.S. average is 0.62%)
- Population growth since 2010: -1.34% (Census Bureau – U.S. average is 5.96%)
- 5-year projected population growth: -0.1% (PwC/ULI – U.S. average is 0.7%)
Pittsburgh Rental Market
- Median 1-bedroom rent: $739 (Rentonomics – U.S. average is $961)
- Median 2-bedroom rent: $925 (Rentonomics – U.S. average is $1,192)
- Year-over-year rent growth: 0.2% (Rentonomics – U.S. average is 1.4%)
- Vacancy rate: 6.3% (Census Bureau – U.S. metropolitan average is 6.7%)
- Percentage of residents who rent their homes: 28.3% (Census Bureau – U.S. metropolitan average is 37.1%)
- Rent list price per square foot: $1.08 (Zillow – U.S. average is $1.14)
- Rental breakeven horizon: 1.4 years (Zillow – U.S. average is 2.0, meaning that buying is more financially advantageous than renting after 2 years)
- Rent to cost of ownership ratio: 1.0 (PwC/ULI – U.S. average is 0.8, meaning that the average rent payment in the area is 20% lower than a mortgage payment)
- Rent as % of household income: 20.7% (PwC/ULI – U.S. average is 33.4%, meaning that the average household spends 33.4% of its income on rent, though under 30% is considered ideal)
Pittsburgh Housing Market
- Median home value: $161,240 (Zillow – U.S. average is $243,225)
- Year-over-year home value growth: 4.8% (Zillow – U.S. average is 3.8%)
- 1-year projected home value growth: 3.8% (Zillow – U.S. average is 2.2%)
- Median list price per square foot: $141 (Zillow – U.S. average is $154)
- Home affordability index: 249.4 (PwC/ULI – U.S. average is 153.0, meaning a resident making the median salary can afford to buy a median-priced home in the area 1.53 times over)
Pittsburgh Economy
- 5-year projected employment growth: 0% (PwC/ULI – U.S. average is 0.6%)
- Cost of living index: 95.3 (City Data – U.S. average is 100)
- Cost of doing business index: 99.5 (PwC/ULI – U.S. average is 100)
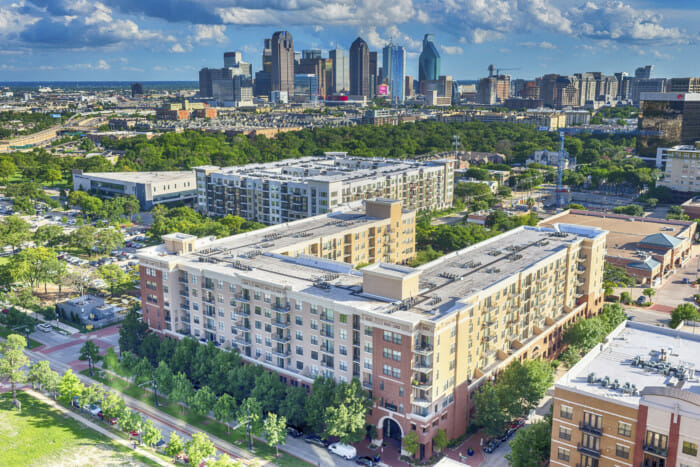
#41: Grand Prairie, Texas
- Metropolitan statistical area: Dallas-Fort Worth-Arlington, TX
- Population: 194,614 (Census Bureau – 2018 estimate)
- Cost of living index: 93.5 (City Data – U.S. average is 100)
Grand Prairie Rental Market
- Median 1-bedroom rent: $1,028 (Rentonomics – U.S. average is $961)
- Median 2-bedroom rent: $1,277 (Rentonomics – U.S. average is $1,192)
- Year-over-year rent growth: 1.5% (Rentonomics – U.S. average is 1.4%)
- Rent list price per square foot: $0.98 (Zillow – U.S. average is $1.14)
- Rental breakeven horizon: 1.3 years (Zillow – U.S. average is 2.0, meaning that buying is more financially advantageous than renting after 2 years)
Grand Prairie Housing Market
- Median home value: $216,433 (Zillow – U.S. average is $243,225)
- Year-over-year home value growth: 6.0% (Zillow – U.S. average is 3.8%)
- 1-year projected home value growth: 2.7% (Zillow – U.S. average is 2.2%)
- Median list price per square foot: $117 (Zillow – U.S. average is $154)
Take a deeper dive into the Dallas-Fort Worth real estate market, as well as other cities in the region: South Central Real Estate Market Trends

#42: Memphis, Tennessee
- Metropolitan statistical area: Memphis, TN-MS-AR
Memphis Population Growth
- Population: 650,618 (Census Bureau – 2018 estimate)
- Population growth since 2017: 0.23% (Census Bureau – U.S. average is 0.62%)
- Population growth since 2010: 1.95% (Census Bureau – U.S. average is 5.96%)
- 5-year projected population growth: 0.5% (PwC/ULI – U.S. average is 0.7%)
Memphis Rental Market
- Median 1-bedroom rent: $706 (Rentonomics – U.S. average is $961)
- Median 2-bedroom rent: $835 (Rentonomics – U.S. average is $1,192)
- Year-over-year rent growth: 0.9% (Rentonomics – U.S. average is 1.4%)
- Vacancy rate: 11.7% (Census Bureau – U.S. metropolitan average is 6.7%)
- Percentage of residents who rent their homes: 36.5% (Census Bureau – U.S. metropolitan average is 37.1%)
- Rent list price per square foot: $0.71 (Zillow – U.S. average is $1.14)
- Rental breakeven horizon: 1.0 years (Zillow – U.S. average is 2.0, meaning that buying is more financially advantageous than renting after 2 years)
- Rent to cost of ownership ratio: 0.7 (PwC/ULI – U.S. average is 0.8, meaning that the average rent payment in the area is 20% lower than a mortgage payment)
- Rent as % of household income: 18.4% (PwC/ULI – U.S. average is 33.4%, meaning that the average household spends 33.4% of its income on rent, though under 30% is considered ideal)
Memphis Housing Market
- Median home value: $95,405 (Zillow – U.S. average is $243,225)
- Year-over-year home value growth: 8.4% (Zillow – U.S. average is 3.8%)
- 1-year projected home value growth: 5.4% (Zillow – U.S. average is 2.2%)
- Median list price per square foot: $71 (Zillow – U.S. average is $154)
- Home affordability index: 180.1 (PwC/ULI – U.S. average is 153.0, meaning a resident making the median salary can afford to buy a median-priced home in the area 1.53 times over)
Memphis Economy
- 5-year projected employment growth: 0.5% (PwC/ULI – U.S. average is 0.6%)
- Cost of living index: 85.1 (City Data – U.S. average is 100)
- Cost of doing business index: 91.4 (PwC/ULI – U.S. average is 100)

#43: St. Paul, Minnesota
- Metropolitan statistical area: Minneapolis-St. Paul-Bloomington, MN-WI
St. Paul Population Growth
- Population: 307,695 (Census Bureau – 2018 estimate)
- Population growth since 2017: 1.02% (Census Bureau – U.S. average is 0.62%)
- Population growth since 2010: 8.37% (Census Bureau – U.S. average is 5.96%)
- 5-year projected population growth: 0.7% (PwC/ULI – U.S. average is 0.7%)
St. Paul Rental Market
- Median 1-bedroom rent: $984 (Rentonomics – U.S. average is $961)
- Median 2-bedroom rent: $1,241 (Rentonomics – U.S. average is $1,192)
- Year-over-year rent growth: 1.3% (Rentonomics – U.S. average is 1.4%)
- Vacancy rate: 4.1% (Census Bureau – U.S. metropolitan average is 6.7%)
- Percentage of residents who rent their homes: 32.2% (Census Bureau – U.S. metropolitan average is 37.1%)
- Rent list price per square foot: $1.34 (Zillow – U.S. average is $1.14)
- Rental breakeven horizon: 1.5 years (Zillow – U.S. average is 2.0, meaning that buying is more financially advantageous than renting after 2 years)
- Rent to cost of ownership ratio: 0.7 (PwC/ULI – U.S. average is 0.8, meaning that the average rent payment in the area is 20% lower than a mortgage payment)
- Rent as % of household income: 19.0% (PwC/ULI – U.S. average is 33.4%, meaning that the average household spends 33.4% of its income on rent, though under 30% is considered ideal)
St. Paul Housing Market
- Median home value: $230,859 (Zillow – U.S. average is $243,225)
- Year-over-year home value growth: 4.1% (Zillow – U.S. average is 3.8%)
- 1-year projected home value growth: 2.2% (Zillow – U.S. average is 2.2%)
- Median list price per square foot: $195 (Zillow – U.S. average is $154)
- Home affordability index: 166.9 (PwC/ULI – U.S. average is 153.0, meaning a resident making the median salary can afford to buy a median-priced home in the area 1.53 times over)
St. Paul Economy
- 5-year projected employment growth: 0.7% (PwC/ULI – U.S. average is 0.6%)
- Cost of living index: 113.7 (City Data – U.S. average is 100)
- Cost of doing business index: 102.7 (PwC/ULI – U.S. average is 100)
Take a deeper dive into the Twin Cities real estate market, as well as other cities in the region: Great Lakes Real Estate Market Trends

#44: Spokane, Washington
- Metropolitan statistical area: Spokane-Spokane Valley, WA
Spokane Population Growth
- Population: 219,190 (Census Bureau – 2018 estimate)
- Population growth since 2017: 1.69% (Census Bureau – U.S. average is 0.62%)
- Population growth since 2010: 8.67% (Census Bureau – U.S. average is 5.96%)
- 5-year projected population growth: 1.1% (PwC/ULI – U.S. average is 0.7%)
Spokane Rental Market
- Rent list price per square foot: $1.30 (Zillow – U.S. average is $1.14)
- Rental breakeven horizon: 2.3 years (Zillow – U.S. average is 2.0, meaning that buying is more financially advantageous than renting after 2 years)
- Rent to cost of ownership ratio: 0.6 (PwC/ULI – U.S. average is 0.8, meaning that the average rent payment in the area is 20% lower than a mortgage payment)
- Rent as % of household income: 19.5% (PwC/ULI – U.S. average is 33.4%, meaning that the average household spends 33.4% of its income on rent, though under 30% is considered ideal)
Spokane Housing Market
- Median home value: $246,374 (Zillow – U.S. average is $243,225)
- Year-over-year home value growth: 10.5% (Zillow – U.S. average is 3.8%)
- 1-year projected home value growth: 5.3% (Zillow – U.S. average is 2.2%)
- Median list price per square foot: $228 (Zillow – U.S. average is $154)
- Home affordability index: 136.5 (PwC/ULI – U.S. average is 153.0, meaning a resident making the median salary can afford to buy a median-priced home in the area 1.53 times over)
Spokane Economy
- 5-year projected employment growth: 0.9% (PwC/ULI – U.S. average is 0.6%)
- Cost of living index: 92.5 (City Data – U.S. average is 100)
- Cost of doing business index: 96.8 (PwC/ULI – U.S. average is 100)
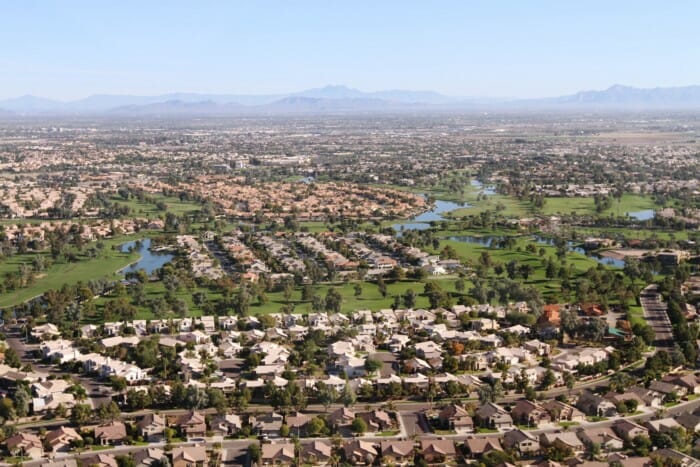
#45: Chandler, Arizona
- Metropolitan statistical area: Phoenix-Mesa-Chandler, AZ
- Population: 257,165 (Census Bureau – 2018 estimate)
- Cost of living index: 95.5 (City Data – U.S. average is 100)
Chandler, AZ Rental Market
- Median 1-bedroom rent: $1,166 (Rentonomics – U.S. average is $961)
- Median 2-bedroom rent: $1,453 (Rentonomics – U.S. average is $1,192)
- Year-over-year rent growth: 4.7% (Rentonomics – U.S. average is 1.4%)
- Rent list price per square foot: $1.05 (Zillow – U.S. average is $1.14)
- Rental breakeven horizon: 2.7 years (Zillow – U.S. average is 2.0, meaning that buying is more financially advantageous than renting after 2 years)
Chandler, AZ Housing Market
- Median home value: $335,455 (Zillow – U.S. average is $243,225)
- Year-over-year home value growth: 5.7% (Zillow – U.S. average is 3.8%)
- 1-year projected home value growth: 3.6% (Zillow – U.S. average is 2.2%)
- Median list price per square foot: $181 (Zillow – U.S. average is $154)

#46: Norfolk, Virginia
- Metropolitan statistical area: Virginia Beach-Norfolk-Newport News, VA-NC
Norfolk, VA Population Growth
- Population: 244,076 (Census Bureau – 2018 estimate)
- Population growth since 2017: 0.22% (Census Bureau – U.S. average is 0.62%)
- Population growth since 2010: 3.10% (Census Bureau – U.S. average is 5.96%)
- 5-year projected population growth: 0.6% (PwC/ULI – U.S. average is 0.7%)
Norfolk, VA Rental Market
- Median 1-bedroom rent: $797 (Rentonomics – U.S. average is $961)
- Median 2-bedroom rent: $959 (Rentonomics – U.S. average is $1,192)
- Year-over-year rent growth: 1.0% (Rentonomics – U.S. average is 1.4%)
- Vacancy rate: 7.1% (Census Bureau – U.S. metropolitan average is 6.7%)
- Percentage of residents who rent their homes: 37.2% (Census Bureau – U.S. metropolitan average is 37.1%)
- Rent list price per square foot: $1.04 (Zillow – U.S. average is $1.14)
- Rental breakeven horizon: 2.3 years (Zillow – U.S. average is 2.0, meaning that buying is more financially advantageous than renting after 2 years)
- Rent to cost of ownership ratio: 0.6 (PwC/ULI – U.S. average is 0.8, meaning that the average rent payment in the area is 20% lower than a mortgage payment)
- Rent as % of household income: 18.3% (PwC/ULI – U.S. average is 33.4%, below 30% is considered ideal)
Norfolk, VA Housing Market
- Median home value: $201,366 (Zillow – U.S. average is $243,225)
- Year-over-year home value growth: 4.2% (Zillow – U.S. average is 3.8%)
- 1-year projected home value growth: 1.1% (Zillow – U.S. average is 2.2%)
- Median list price per square foot: $144 (Zillow – U.S. average is $154)
- Home affordability index: 149.6 (PwC/ULI – U.S. average is 153.0, meaning a resident making the median salary can afford to buy a median-priced home in the area 1.53 times over)
Norfolk, VA Economy
- 5-year projected employment growth: 0.5% (PwC/ULI – U.S. average is 0.6%)
- Cost of living index: 96.7 (City Data – U.S. average is 100)
- Cost of doing business index: 99.1 (PwC/ULI – U.S. average is 100)

#47: Gilbert, Arizona
- Metropolitan statistical area: Phoenix-Mesa-Chandler, AZ
- Population: 248,279 (Census Bureau – 2018 estimate)
- Cost of living index: 95.6 (City Data – U.S. average is 100)
Gilbert, AZ Rental Market
- Median 1-bedroom rent: $1,237 (Rentonomics – U.S. average is $961)
- Median 2-bedroom rent: $1,541 (Rentonomics – U.S. average is $1,192)
- Year-over-year rent growth: 4.5% (Rentonomics – U.S. average is 1.4%)
- Rent list price per square foot: $0.93 (Zillow – U.S. average is $1.14)
- Rental breakeven horizon: 2.9 years (Zillow – U.S. average is 2.0, meaning that buying is more financially advantageous than renting after 2 years)
Gilbert, AZ Housing Market
- Median home value: $356,006 (Zillow – U.S. average is $243,225)
- Year-over-year home value growth: 5.7% (Zillow – U.S. average is 3.8%)
- 1-year projected home value growth: 3.6% (Zillow – U.S. average is 2.2%)
- Median list price per square foot: $170 (Zillow – U.S. average is $154)
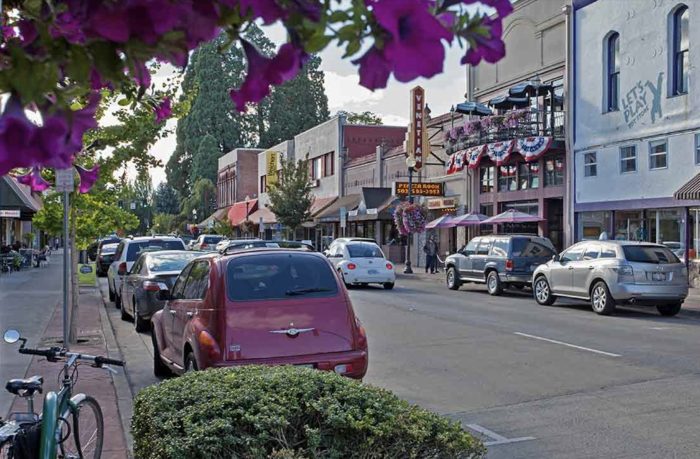
#48: Hillsboro, Oregon
- Metropolitan statistical area: Portland-Vancouver-Hillsboro, OR-WA
- Population: 108,389 (Census Bureau – 2018 estimate)
- Cost of living index: 103.1 (City Data – U.S. average is 100)
Hillsboro, OR Rental Market
- Vacancy rate: 3.8% (Census Bureau – U.S. metropolitan average is 6.7%)
- Percentage of residents who rent their homes: 40.8% (Census Bureau – U.S. metropolitan average is 37.1%)
- Rent list price per square foot: $1.16 (Zillow – U.S. average is $1.14)
- Rental breakeven horizon: 2.9 years (Zillow – U.S. average is 2.0, meaning that buying is more financially advantageous than renting after 2 years)
Hillsboro, OR Housing Market
- Median home value: $389,619 (Zillow – U.S. average is $243,225)
- Year-over-year home value growth: 2.7% (Zillow – U.S. average is 3.8%)
- 1-year projected home value growth: 1.1% (Zillow – U.S. average is 2.2%)
- Median list price per square foot: $228 (Zillow – U.S. average is $154)

#49: Lexington, Kentucky
- Metropolitan statistical area: Lexington-Fayette, KY
- Cost of living index: 89.3 (City Data – U.S. average is 100)
Lexington, KY Population Growth
- Population: 323,780 (Census Bureau – 2018 estimate)
- Population growth since 2017: 0.77% (Census Bureau – U.S. average is 0.62%)
- Population growth since 2010: 9.45% (Census Bureau – U.S. average is 5.96%)
Lexington, KY Rental Market
- Median 1-bedroom rent: $670 (Rentonomics – U.S. average is $961)
- Median 2-bedroom rent: $859 (Rentonomics – U.S. average is $1,192)
- Year-over-year rent growth: 1.0% (Rentonomics – U.S. average is 1.4%)
- Rent list price per square foot: $0.97 (Zillow – U.S. average is $1.14)
- Rental breakeven horizon: 1.9 years (Zillow – U.S. average is 2.0, meaning that buying is more financially advantageous than renting after 2 years)
Lexington, KY Housing Market
- Median home value: $193,979 (Zillow – U.S. average is $243,225)
- Year-over-year home value growth: 4.2% (Zillow – U.S. average is 3.8%)
- 1-year projected home value growth: 2.1% (Zillow – U.S. average is 2.2%)
- Median list price per square foot: $139 (Zillow – U.S. average is $154)

#50: St. Petersburg, Florida
- Metropolitan statistical area: Tampa-St. Petersburg-Clearwater, FL
St. Petersburg Population Growth
- Population: 265,098 (Census Bureau – 2018 estimate)
- Population growth since 2017: 1.66% (Census Bureau – U.S. average is 0.62%)
- Population growth since 2010: 12.90% (Census Bureau – U.S. average is 5.96%)
- 5-year projected population growth: 1.1% (PwC/ULI – U.S. average is 0.7%)
St. Petersburg Rental Market
- Median 1-bedroom rent: $968 (Rentonomics – U.S. average is $961)
- Median 2-bedroom rent: $1,205 (Rentonomics – U.S. average is $1,192)
- Year-over-year rent growth: 1.5% (Rentonomics – U.S. average is 1.4%)
- Vacancy rate: 9.9% (Census Bureau – U.S. metropolitan average is 6.7%)
- Percentage of residents who rent their homes: 35.1% (Census Bureau – U.S. metropolitan average is 37.1%)
- Rent list price per square foot: $1.43 (Zillow – U.S. average is $1.14)
- Rent to cost of ownership ratio: 0.7 (PwC/ULI – U.S. average is 0.8, meaning that the average rent payment in the area is 20% lower than a mortgage payment)
- Rent as % of household income: 24.2% (PwC/ULI – U.S. average is 33.4%, below 30% is considered ideal)
St. Petersburg Housing Market
- Median home value: $227,087 (Zillow – U.S. average is $243,225)
- Year-over-year home value growth: 5.2% (Zillow – U.S. average is 3.8%)
- 1-year projected home value growth: 4.6% (Zillow – U.S. average is 2.2%)
- Median list price per square foot: $210 (Zillow – U.S. average is $154)
- Home affordability index: 148.8 (PwC/ULI – U.S. average is 153.0, meaning a resident making the median salary can afford to buy a median-priced home in the area 1.53 times over)
St. Petersburg Economy
- 5-year projected employment growth: 1.2% (PwC/ULI – U.S. average is 0.6%)
- Cost of living index: 95.3 (City Data – U.S. average is 100)
- Cost of doing business index: 102.0 (PwC/ULI – U.S. average is 100)
Tier II: 50 More Up-and-Coming Real Estate Markets to Watch in 2020

#51: Manchester, New Hampshire
- Metropolitan statistical area: Manchester-Nashua, NH
- Cost of living index: 119.4 (City Data – U.S. average is 100)
Manchester, NH Population Growth
- Population: 112,525 (Census Bureau – 2018 estimate)
- Population growth since 2017: 0.51% (Census Bureau – U.S. average is 0.62%)
- Population growth since 2010: 3.63% (Census Bureau – U.S. average is 5.96%)
Manchester, NH Rental Market
- Median 1-bedroom rent: $1,080 (Rentonomics – U.S. average is $961)
- Median 2-bedroom rent: $1,372 (Rentonomics – U.S. average is $1,192)
- Year-over-year rent growth: 1.4% (Rentonomics – U.S. average is 1.4%)
- Rent list price per square foot: $1.49 (Zillow – U.S. average is $1.14)
- Rental breakeven horizon: 2.0 years (Zillow – U.S. average is 2.0, meaning that buying is more financially advantageous than renting after 2 years)
Manchester, NH Housing Market
- Median home value: $254,260 (Zillow – U.S. average is $243,225)
- Year-over-year home value growth: 4.8% (Zillow – U.S. average is 3.8%)
- 1-year projected home value growth: 3.6% (Zillow – U.S. average is 2.2%)
- Median list price per square foot: $186 (Zillow – U.S. average is $154)
Take a deep dive into the New England real estate market to learn what’s going on in Manchester and other cities within the region: Boston Rental Market Trends

#52: Dallas, Texas
- Metropolitan statistical area: Dallas-Fort Worth-Arlington, TX
Dallas Population Growth
- Population: 1,345,047 (Census Bureau – 2018 estimate)
- Population growth since 2017: 1.78% (Census Bureau – U.S. average is 0.62%)
- Population growth since 2010: 17.33% (Census Bureau – U.S. average is 5.96%)
- 5-year projected population growth: 1.6% (PwC/ULI – U.S. average is 0.7%)
Dallas Rental Market
- Median 1-bedroom rent: $915 (Rentonomics – U.S. average is $961)
- Median 2-bedroom rent: $1,136 (Rentonomics – U.S. average is $1,192)
- Year-over-year rent growth: 2.2% (Rentonomics – U.S. average is 1.4%)
- Vacancy rate: 7.4% (Census Bureau – U.S. metropolitan average is 6.7%)
- Percentage of residents who rent their homes: 38.0% (Census Bureau – U.S. metropolitan average is 37.1%)
- Rent list price per square foot: $1.30 (Zillow – U.S. average is $1.14)
- Rent to cost of ownership ratio: 0.6 (PwC/ULI – U.S. average is 0.8, meaning that the average rent payment in the area is 20% lower than a mortgage payment)
- Rent as % of household income: 18.2% (PwC/ULI – U.S. average is 33.4%, below 30% is considered ideal)
Dallas Housing Market
- Median home value: $218,794 (Zillow – U.S. average is $243,225)
- Year-over-year home value growth: 7.6% (Zillow – U.S. average is 3.8%)
- 1-year projected home value growth: 5.4% (Zillow – U.S. average is 2.2%)
- Median list price per square foot: $202 (Zillow – U.S. average is $154)
- Home affordability index: 147.0 (PwC/ULI – U.S. average is 153.0, meaning a resident making the median salary can afford to buy a median-priced home in the area 1.53 times over)
Dallas Economy
- 5-year projected employment growth: 1.4% (PwC/ULI – U.S. average is 0.6%)
- Cost of living index: 95.1 (City Data – U.S. average is 100)
- Cost of doing business index: 99.3 (PwC/ULI – U.S. average is 100)
Take a deeper dive into the Dallas-Fort Worth real estate market, as well as other cities in the region: South Central Real Estate Market Trends

#53: Mesa, Arizona
- Metropolitan statistical area: Phoenix-Mesa-Chandler, AZ
- Population: 508,958 (Census Bureau – 2018 estimate)
- Cost of living index: 95.2 (City Data – U.S. average is 100)
Mesa Rental Market
- Median 1-bedroom rent: $912 (Rentonomics – U.S. average is $961)
- Median 2-bedroom rent: $1,136 (Rentonomics – U.S. average is $1,192)
- Year-over-year rent growth: 5.1% (Rentonomics – U.S. average is 1.4%)
- Vacancy rate: 6.2% (Census Bureau – U.S. metropolitan average is 6.7%)
- Percentage of residents who rent their homes: 34.7% (Census Bureau – U.S. metropolitan average is 37.1%)
- Rent list price per square foot: $1.04 (Zillow – U.S. average is $1.14)
- Rental breakeven horizon: 2.3 years (Zillow – U.S. average is 2.0, meaning that buying is more financially advantageous than renting after 2 years)
Mesa Housing Market
- Median home value: $268,461 (Zillow – U.S. average is $243,225)
- Year-over-year home value growth: 6.8% (Zillow – U.S. average is 3.8%)
- 1-year projected home value growth: 4.2% (Zillow – U.S. average is 2.2%)
- Median list price per square foot: $164 (Zillow – U.S. average is $154)

#54: Gainesville, Florida
- Metropolitan statistical area: Gainesville, FL
Gainesville Population Growth
- Population: 133,857 (Census Bureau – 2018 estimate)
- Population growth since 2017: 1.24% (Census Bureau – U.S. average is 0.62%)
- Population growth since 2010: 9.06% (Census Bureau – U.S. average is 5.96%)
- 5-year projected population growth: 0.4% (PwC/ULI – U.S. average is 0.7%)
Gainesville Rental Market
- Median 1-bedroom rent: $793 (Rentonomics – U.S. average is $961)
- Median 2-bedroom rent: $972 (Rentonomics – U.S. average is $1,192)
- Year-over-year rent growth: 0.8% (Rentonomics – U.S. average is 1.4%)
- Rent list price per square foot: $0.96 (Zillow – U.S. average is $1.14)
- Rental breakeven horizon: 1.9 years (Zillow – U.S. average is 2.0, meaning that buying is more financially advantageous than renting after 2 years)
- Rent to cost of ownership ratio: 0.8 (PwC/ULI – U.S. average is 0.8, meaning that the average rent payment in the area is 20% lower than a mortgage payment)
- Rent as % of household income: 27.0% (PwC/ULI – U.S. average is 33.4%, below 30% is considered ideal)
Gainesville Housing Market
- Median home value: $198,541 (Zillow – U.S. average is $243,225)
- Year-over-year home value growth: 6.6% (Zillow – U.S. average is 3.8%)
- 1-year projected home value growth: 2.7% (Zillow – U.S. average is 2.2%)
- Median list price per square foot: $136 (Zillow – U.S. average is $154)
- Home affordability index: 180.0 (PwC/ULI – U.S. average is 153.0, meaning a resident making the median salary can afford to buy a median-priced home in the area 1.53 times over)
Gainesville Economy
- 5-year projected employment growth: 0.5% (PwC/ULI – U.S. average is 0.6%)
- Cost of living index: 88.7 (City Data – U.S. average is 100)
- Cost of doing business index: 97.3 (PwC/ULI – U.S. average is 100)

#55: Bakersfield, California
- Metropolitan statistical area: Bakersfield, CA
- Cost of living index: 92.2 (City Data – U.S. average is 100)
Bakersfield Population Growth
- Population: 383,579 (Census Bureau – 2018 estimate)
- Population growth since 2017: 0.87% (Census Bureau – U.S. average is 0.62%)
- Population growth since 2010: 6.81% (Census Bureau – U.S. average is 5.96%)
Bakersfield Rental Market
- Median 1-bedroom rent: $734 (Rentonomics – U.S. average is $961)
- Median 2-bedroom rent: $953 (Rentonomics – U.S. average is $1,192)
- Year-over-year rent growth: 1.3% (Rentonomics – U.S. average is 1.4%)
- Rent list price per square foot: $0.96 (Zillow – U.S. average is $1.14)
- Rental breakeven horizon: 2.0 years (Zillow – U.S. average is 2.0, meaning that buying is more financially advantageous than renting after 2 years)
Bakersfield Housing Market
- Median home value: $249,691 (Zillow – U.S. average is $243,225)
- Year-over-year home value growth: 4.4% (Zillow – U.S. average is 3.8%)
- 1-year projected home value growth: 2.7% (Zillow – U.S. average is 2.2%)
- Median list price per square foot: $150 (Zillow – U.S. average is $154)

#56: Aurora, Colorado
- Metropolitan statistical area: Denver-Aurora-Lakewood, CO
- Population: 374,114 (Census Bureau – 2018 estimate)
- Cost of living index: 110.6 (City Data – U.S. average is 100)
Aurora Rental Market
- Median 1-bedroom rent: $1,248 (Rentonomics – U.S. average is $961)
- Median 2-bedroom rent: $1,580 (Rentonomics – U.S. average is $1,192)
- Year-over-year rent growth: 1.4% (Rentonomics – U.S. average is 1.4%)
- Vacancy rate: 3.8% (Census Bureau – U.S. metropolitan average is 6.7%)
- Percentage of residents who rent their homes: 39.9% (Census Bureau – U.S. metropolitan average is 37.1%)
- Rent list price per square foot: $1.47 (Zillow – U.S. average is $1.14)
- Rental breakeven horizon: 1.8 years (Zillow – U.S. average is 2.0, meaning that buying is more financially advantageous than renting after 2 years)
Aurora Housing Market
- Median home value: $351,257 (Zillow – U.S. average is $243,225)
- Year-over-year home value growth: 2.1% (Zillow – U.S. average is 3.8%)
- 1-year projected home value growth: 2.9% (Zillow – U.S. average is 2.2%)
- Median list price per square foot: $223 (Zillow – U.S. average is $154)

#57: Riverside, California
- Metropolitan statistical area: Riverside-San Bernardino-Ontario, CA
Riverside Population Growth
- Population: 330,063 (Census Bureau – 2018 estimate)
- Population growth since 2017: 1.14% (Census Bureau – U.S. average is 0.62%)
- Population growth since 2010: 9.41% (Census Bureau – U.S. average is 5.96%)
- 5-year projected population growth: 1.4% (PwC/ULI – U.S. average is 0.7%)
Riverside Rental Market
- Median 1-bedroom rent: $1,081 (Rentonomics – U.S. average is $961)
- Median 2-bedroom rent: $1,352 (Rentonomics – U.S. average is $1,192)
- Year-over-year rent growth: 1.8% (Rentonomics – U.S. average is 1.4%)
- Vacancy rate: 5.1% (Census Bureau – U.S. metropolitan average is 6.7%)
- Rent list price per square foot: $1.39 (Zillow – U.S. average is $1.14)
- Rental breakeven horizon: 1.9 years (Zillow – U.S. average is 2.0, meaning that buying is more financially advantageous than renting after 2 years)
- Rent to cost of ownership ratio: 0.6 (PwC/ULI – U.S. average is 0.8, meaning that the average rent payment in the area is 20% lower than a mortgage payment)
- Rent as % of household income: 24.8% (PwC/ULI – U.S. average is 33.4%, below 30% is considered ideal)
Riverside Housing Market
- Median home value: $417,765 (Zillow – U.S. average is $243,225)
- Year-over-year home value growth: 2.5% (Zillow – U.S. average is 3.8%)
- 1-year projected home value growth: 1.3% (Zillow – U.S. average is 2.2%)
- Median list price per square foot: $249 (Zillow – U.S. average is $154)
- Home affordability index: 91.5 (PwC/ULI – U.S. average is 153.0, meaning a resident making the median salary can afford to buy a median-priced home in the area 1.53 times over)
Riverside Economy
- 5-year projected employment growth: 1.3% (PwC/ULI – U.S. average is 0.6%)
- Cost of living index: 82.0 (City Data – U.S. average is 100)
- Cost of doing business index: 109.4 (PwC/ULI – U.S. average is 100)
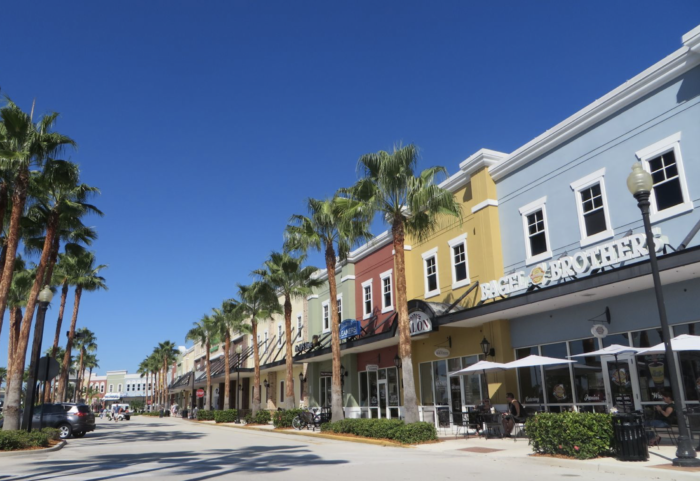
#58: Port St. Lucie, Florida
- Metropolitan statistical area: Port St. Lucie, FL
- Cost of living index: 90.6 (City Data – U.S. average is 100)
Port St. Lucie Population Growth
- Population: 195,248 (Census Bureau – 2018 estimate)
- Population growth since 2017: 1.87% (Census Bureau – U.S. average is 0.62%)
- Population growth since 2010: 13.66% (Census Bureau – U.S. average is 5.96%)
Port St. Lucie Rental Market
- Rent list price per square foot: $1.04 (Zillow – U.S. average is $1.14)
- Rental breakeven horizon: 1.8 years (Zillow – U.S. average is 2.0, meaning that buying is more financially advantageous than renting after 2 years)
Port St. Lucie Housing Market
- Median home value: $232,576 (Zillow – U.S. average is $243,225)
- Year-over-year home value growth: 3.3% (Zillow – U.S. average is 3.8%)
- 1-year projected home value growth: 1.2% (Zillow – U.S. average is 2.2%)
- Median list price per square foot: $140 (Zillow – U.S. average is $154)

#59: Springfield, Missouri
- Metropolitan statistical area: Springfield, MO
- Cost of living index: 82.7 (City Data – U.S. average is 100)
Springfield, MO Population Growth
- Population: 168,122 (Census Bureau – 2018 estimate)
- Population growth since 2017: 1.01% (Census Bureau – U.S. average is 0.62%)
- Population growth since 2010: 6.93% (Census Bureau – U.S. average is 5.96%)
Springfield, MO Rental Market
- Median 1-bedroom rent: $535 (Rentonomics – U.S. average is $961)
- Median 2-bedroom rent: $697 (Rentonomics – U.S. average is $1,192)
- Year-over-year rent growth: 1.8% (Rentonomics – U.S. average is 1.4%)
- Rent list price per square foot: $0.71 (Zillow – U.S. average is $1.14)
- Rental breakeven horizon: 1.7 years (Zillow – U.S. average is 2.0, meaning that buying is more financially advantageous than renting after 2 years)
Springfield, MO Housing Market
- Median home value: $144,982 (Zillow – U.S. average is $243,225)
- Year-over-year home value growth: 7.0% (Zillow – U.S. average is 3.8%)
- 1-year projected home value growth: 5.3% (Zillow – U.S. average is 2.2%)
- Median list price per square foot: $99 (Zillow – U.S. average is $154)

#60: Cape Coral, Florida
- Metropolitan statistical area: Cape Coral-Fort Myers, FL
Cape Coral Population Growth
- Population: 189,343 (Census Bureau – 2018 estimate)
- Population growth since 2017: 2.04% (Census Bureau – U.S. average is 0.62%)
- Population growth since 2010: 21.96% (Census Bureau – U.S. average is 5.96%)
- 5-year projected population growth: 1.8% (PwC/ULI – U.S. average is 0.7%)
Cape Coral Rental Market
- Median 1-bedroom rent: $905 (Rentonomics – U.S. average is $961)
- Median 2-bedroom rent: $1,124 (Rentonomics – U.S. average is $1,192)
- Year-over-year rent growth: 1.1% (Rentonomics – U.S. average is 1.4%)
- Vacancy rate: 5.8% (Census Bureau – U.S. metropolitan average is 6.7%)
- Percentage of residents who rent their homes: 24.9% (Census Bureau – U.S. metropolitan average is 37.1%)
- Rent list price per square foot: $1.08 (Zillow – U.S. average is $1.14)
- Rental breakeven horizon: 1.8 years (Zillow – U.S. average is 2.0, meaning that buying is more financially advantageous than renting after 2 years)
- Rent to cost of ownership ratio: 0.6 (PwC/ULI – U.S. average is 0.8, meaning that the average rent payment in the area is 20% lower than a mortgage payment)
- Rent as % of household income: 21.9% (PwC/ULI – U.S. average is 33.4%, below 30% is considered ideal)
Cape Coral Housing Market
- Median home value: $233,733 (Zillow – U.S. average is $243,225)
- Year-over-year home value growth: 3.8% (Zillow – U.S. average is 3.8%)
- 1-year projected home value growth: 0.6% (Zillow – U.S. average is 2.2%)
- Median list price per square foot: $153 (Zillow – U.S. average is $154)
- Home affordability index: 113.0 (PwC/ULI – U.S. average is 153.0, meaning a resident making the median salary can afford to buy a median-priced home in the area 1.53 times over)
Cape Coral Economy
- 5-year projected employment growth: 1.7% (PwC/ULI – U.S. average is 0.6%)
- Cost of living index: 92.6 (City Data – U.S. average is 100)
- Cost of doing business index: 100.7 (PwC/ULI – U.S. average is 100)

#61: Knoxville, Tennessee
- Metropolitan statistical area: Knoxville, TN
Knoxville Population Growth
- Population: 187,500 (Census Bureau – 2018 estimate)
- Population growth since 2017: 0.86% (Census Bureau – U.S. average is 0.62%)
- Population growth since 2010: 5.45% (Census Bureau – U.S. average is 5.96%)
- 5-year projected population growth: 0.6% (PwC/ULI – U.S. average is 0.7%)
Knoxville Rental Market
- Vacancy rate: 7.4% (Census Bureau – U.S. metropolitan average is 6.7%)
- Percentage of residents who rent their homes: 31.5% (Census Bureau – U.S. metropolitan average is 37.1%)
- Rent list price per square foot: $0.94 (Zillow – U.S. average is $1.14)
- Rental breakeven horizon: 1.5 years (Zillow – U.S. average is 2.0, meaning that buying is more financially advantageous than renting after 2 years)
- Rent to cost of ownership ratio: 0.6 (PwC/ULI – U.S. average is 0.8, meaning that the average rent payment in the area is 20% lower than a mortgage payment)
- Rent as % of household income: 16.2% (PwC/ULI – U.S. average is 33.4%, below 30% is considered ideal)
Knoxville Housing Market
- Median home value: $194,830 (Zillow – U.S. average is $243,225)
- Year-over-year home value growth: 7.4% (Zillow – U.S. average is 3.8%)
- 1-year projected home value growth: 5.1% (Zillow – U.S. average is 2.2%)
- Median list price per square foot: $127 (Zillow – U.S. average is $154)
- Home affordability index: 173.7 (PwC/ULI – U.S. average is 153.0, meaning a resident making the median salary can afford to buy a median-priced home in the area 1.53 times over)
Knoxville Economy
- 5-year projected employment growth: 0.7% (PwC/ULI – U.S. average is 0.6%)
- Cost of living index: 86.1 (City Data – U.S. average is 100)
- Cost of doing business index: 89.9 (PwC/ULI – U.S. average is 100)

#62: Seattle, Washington
- Metropolitan statistical area: Seattle-Tacoma-Bellevue, WA
Seattle Population Growth
- Population: 744,955 (Census Bureau – 2018 estimate)
- Population growth since 2017: 1.41% (Census Bureau – U.S. average is 0.62%)
- Population growth since 2010: 14.52% (Census Bureau – U.S. average is 5.96%)
- 5-year projected population growth: 1.0% (PwC/ULI – U.S. average is 0.7%)
Seattle Rental Market
- Median 1-bedroom rent: $1,345 (Rentonomics – U.S. average is $961)
- Median 2-bedroom rent: $1,675 (Rentonomics – U.S. average is $1,192)
- Year-over-year rent growth: 1.8% (Rentonomics – U.S. average is 1.4%)
- Vacancy rate: 4.8% (Census Bureau – U.S. metropolitan average is 6.7%)
- Percentage of residents who rent their homes: 37.5% (Census Bureau – U.S. metropolitan average is 37.1%)
- Rent list price per square foot: $2.13 (Zillow – U.S. average is $1.14)
- Rental breakeven horizon: 2.1 years (Zillow – U.S. average is 2.0, meaning that buying is more financially advantageous than renting after 2 years)
- Rent to cost of ownership ratio: 0.5 (PwC/ULI – U.S. average is 0.8, meaning that the average rent payment in the area is 20% lower than a mortgage payment)
- Rent as % of household income: 22.9% (PwC/ULI – U.S. average is 33.4%, below 30% is considered ideal)
Seattle Housing Market
- Median home value: $729,381 (Zillow – U.S. average is $243,225)
- Year-over-year home value growth: -3.9% (Zillow – U.S. average is 3.8%)
- 1-year projected home value growth: 0.5% (Zillow – U.S. average is 2.2%)
- Median list price per square foot: $511 (Zillow – U.S. average is $154)
- Home affordability index: 98.4 (PwC/ULI – U.S. average is 153.0, meaning a resident making the median salary can afford to buy a median-priced home in the area 1.53 times over)
Seattle Economy
- 5-year projected employment growth: 0.8% (PwC/ULI – U.S. average is 0.6%)
- Cost of living index: 124.9 (City Data – U.S. average is 100)
- Cost of doing business index: 118.0 (PwC/ULI – U.S. average is 100)

#63: Cleveland, Ohio
- Metropolitan statistical area: Cleveland-Elyria, OH
Cleveland Population Growth
- Population: 383,793 (Census Bureau – 2018 estimate)
- Population growth since 2017: -0.07% (Census Bureau – U.S. average is 0.62%)
- Population growth since 2010: -0.98% (Census Bureau – U.S. average is 5.96%)
- 5-year projected population growth: 0% (PwC/ULI – U.S. average is 0.7%)
Cleveland Rental Market
- Vacancy rate: 6.9% (Census Bureau – U.S. metropolitan average is 6.7%)
- Percentage of residents who rent their homes: 33.3% (Census Bureau – U.S. metropolitan average is 37.1%)
- Rent list price per square foot: $0.78 (Zillow – U.S. average is $1.14)
- Rental breakeven horizon: 7 months (Zillow – U.S. average is 2.0, meaning that buying is more financially advantageous than renting after 2 years)
- Rent to cost of ownership ratio: 0.9 (PwC/ULI – U.S. average is 0.8, meaning that the average rent payment in the area is 20% lower than a mortgage payment)
- Rent as % of household income: 19.8% (PwC/ULI – U.S. average is 33.4%, below 30% is considered ideal)
Cleveland Housing Market
- Median home value: $67,207 (Zillow – U.S. average is $243,225)
- Year-over-year home value growth: 8.0% (Zillow – U.S. average is 3.8%)
- 1-year projected home value growth: 2.1% (Zillow – U.S. average is 2.2%)
- Median list price per square foot: $70 (Zillow – U.S. average is $154)
- Home affordability index: 231.9 (PwC/ULI – U.S. average is 153.0, meaning a resident making the median salary can afford to buy a median-priced home in the area 1.53 times over)
Cleveland Economy
- 5-year projected employment growth: 0% (PwC/ULI – U.S. average is 0.6%)
- Cost of living index: 94.7 (City Data – U.S. average is 100)
- Cost of doing business index: 92.7 (PwC/ULI – U.S. average is 100)

#64: Ontario, California
- Metropolitan statistical area: Riverside-San Bernardino-Ontario, CA
Ontario, CA Population Growth
- Population: 181,107 (Census Bureau – 2018 estimate)
- Population growth since 2017: 1.14% (Census Bureau – U.S. average is 0.62%)
- Population growth since 2010: 9.41% (Census Bureau – U.S. average is 5.96%)
- 5-year projected population growth: 1.4% (PwC/ULI – U.S. average is 0.7%)
Ontario, CA Rental Market
- Median 1-bedroom rent: $1,211 (Rentonomics – U.S. average is $961)
- Median 2-bedroom rent: $1,514 (Rentonomics – U.S. average is $1,192)
- Year-over-year rent growth: 1.6% (Rentonomics – U.S. average is 1.4%)
- Vacancy rate: 5.1% (Census Bureau – U.S. metropolitan average is 6.7%)
- Percentage of residents who rent their homes: 37.7% (Census Bureau – U.S. metropolitan average is 37.1%)
- Rent list price per square foot: $1.44 (Zillow – U.S. average is $1.14)
- Rental breakeven horizon: 2.1 years (Zillow – U.S. average is 2.0, meaning that buying is more financially advantageous than renting after 2 years)
- Rent to cost of ownership ratio: 0.6 (PwC/ULI – U.S. average is 0.8, meaning that the average rent payment in the area is 20% lower than a mortgage payment)
- Rent as % of household income: 24.8% (PwC/ULI – U.S. average is 33.4%, below 30% is considered ideal)
Ontario, CA Housing Market
- Median home value: $442,269 (Zillow – U.S. average is $243,225)
- Year-over-year home value growth: 2.2% (Zillow – U.S. average is 3.8%)
- 1-year projected home value growth: 2.3% (Zillow – U.S. average is 2.2%)
- Median list price per square foot: $266 (Zillow – U.S. average is $154)
- Home affordability index: 91.5 (PwC/ULI – U.S. average is 153.0, meaning a resident making the median salary can afford to buy a median-priced home in the area 1.53 times over)
Ontario, CA Economy
- 5-year projected employment growth: 1.3% (PwC/ULI – U.S. average is 0.6%)
- Cost of living index: 82.8 (City Data – U.S. average is 100)
- Cost of doing business index: 109.4 (PwC/ULI – U.S. average is 100)

#65: Baltimore, Maryland
- Metropolitan statistical area: Baltimore-Columbia-Towson, MD
Baltimore Population Growth
- Population: 602,495 (Census Bureau – 2018 estimate)
- Population growth since 2017: 0.15% (Census Bureau – U.S. average is 0.62%)
- Population growth since 2010: 3.40% (Census Bureau – U.S. average is 5.96%)
- 5-year projected population growth: 0.3% (PwC/ULI – U.S. average is 0.7%)
Baltimore Rental Market
- Median 1-bedroom rent: $948 (Rentonomics – U.S. average is $961)
- Median 2-bedroom rent: $1,190 (Rentonomics – U.S. average is $1,192)
- Year-over-year rent growth: 0.2% (Rentonomics – U.S. average is 1.4%)
- Vacancy rate: 9.4% (Census Bureau – U.S. metropolitan average is 6.7%)
- Percentage of residents who rent their homes: 36.5% (Census Bureau – U.S. metropolitan average is 37.1%)
- Rent to cost of ownership ratio: 0.7 (PwC/ULI – U.S. average is 0.8, meaning that the average rent payment in the area is 20% lower than a mortgage payment)
- Rent as % of household income: 18.1% (PwC/ULI – U.S. average is 33.4%, below 30% is considered ideal)
- Rent list price per square foot: $1.20 (Zillow – U.S. average is $1.14)
- Rental breakeven horizon: 11 months (Zillow – U.S. average is 2.0, meaning that buying is more financially advantageous than renting after 2 years)
Baltimore Housing Market
- Median home value: $148,073 (Zillow – U.S. average is $243,225)
- Year-over-year home value growth: 2.4% (Zillow – U.S. average is 3.8%)
- 1-year projected home value growth: 1.6% (Zillow – U.S. average is 2.2%)
- Median list price per square foot: $137 (Zillow – U.S. average is $154)
- Home affordability index: 169.1 (PwC/ULI – U.S. average is 153.0, meaning a resident making the median salary can afford to buy a median-priced home in the area 1.53 times over)
Baltimore Economy
- 5-year projected employment growth: 0.5% (PwC/ULI – U.S. average is 0.6%)
- Cost of living index: 129.3 (City Data – U.S. average is 100)
- Cost of doing business index: 110.4 (PwC/ULI – U.S. average is 100)

#66: Athens, Georgia
- Metropolitan statistical area: Athens-Clarke County, GA
- Cost of living index: 99.5 (City Data – U.S. average is 100)
Athens, GA Population Growth
- Population: 125,964 (Census Bureau – 2018 estimate)
- Population growth since 2017: 1.10% (Census Bureau – U.S. average is 0.62%)
- Population growth since 2010: 9.73% (Census Bureau – U.S. average is 5.96%)
Athens, GA Rental Market
- Median 1-bedroom rent: $808 (Rentonomics – U.S. average is $961)
- Median 2-bedroom rent: $946 (Rentonomics – U.S. average is $1,192)
- Year-over-year rent growth: 4.5% (Rentonomics – U.S. average is 1.4%)
- Rental breakeven horizon: 1.9 years (Zillow – U.S. average is 2.0, meaning that buying is more financially advantageous than renting after 2 years)
Athens, GA Housing Market
- Median home value: $196,486 (Zillow – U.S. average is $243,225)
- Year-over-year home value growth: 8.4% (Zillow – U.S. average is 3.8%)
- 1-year projected home value growth: 6.7% (Zillow – U.S. average is 2.2%)
- Median list price per square foot: $118 (Zillow – U.S. average is $154)

#67: Detroit, Michigan
- Metropolitan statistical area: Detroit-Warren-Dearborn, MI
Detroit Population Growth
- Population: 672,662 (Census Bureau – 2018 estimate)
- Population growth since 2017: -0.14% (Census Bureau – U.S. average is 0.62%)
- Population growth since 2010: -3.66% (Census Bureau – U.S. average is 5.96%)
- 5-year projected population growth: 0% (PwC/ULI – U.S. average is 0.7%)
Detroit Rental Market
- Median 1-bedroom rent: $690 (Rentonomics – U.S. average is $961)
- Median 2-bedroom rent: $898 (Rentonomics – U.S. average is $1,192)
- Year-over-year rent growth: 0.2% (Rentonomics – U.S. average is 1.4%)
- Vacancy rate: 6.8% (Census Bureau – U.S. metropolitan average is 6.7%)
- Percentage of residents who rent their homes: 29.1% (Census Bureau – U.S. metropolitan average is 37.1%)
- Rent list price per square foot: $0.80 (Zillow – U.S. average is $1.14)
- Rental breakeven horizon: 4 months (Zillow – U.S. average is 2.0, meaning that buying is more financially advantageous than renting after 2 years)
- Rent to cost of ownership ratio: 0.8 (PwC/ULI – U.S. average is 0.8, meaning that the average rent payment in the area is 20% lower than a mortgage payment)
- Rent as % of household income: 20.0% (PwC/ULI – U.S. average is 33.4%, below 30% is considered ideal)
Detroit Housing Market
- Median home value: $34,814 (Zillow – U.S. average is $243,225)
- Year-over-year home value growth: 9.5% (Zillow – U.S. average is 3.8%)
- 1-year projected home value growth: 2.0% (Zillow – U.S. average is 2.2%)
- Home affordability index: 200.6 (PwC/ULI – U.S. average is 153.0, meaning a resident making the median salary can afford to buy a median-priced home in the area 1.53 times over)
Detroit Economy
- 5-year projected employment growth: 0% (PwC/ULI – U.S. average is 0.6%)
- Cost of living index: 87.4 (City Data – U.S. average is 100)
- Cost of doing business index: 96.1 (PwC/ULI – U.S. average is 100)
Take a deeper dive into the real estate market in Detroit, as well as other cities in the region: Great Lakes Real Estate Market Trends

#68: San Diego, California
- Metropolitan statistical area: San Diego-Chula Vista-Carlsbad, CA
San Diego Population Growth
- Population: 1,425,976 (Census Bureau – 2018 estimate)
- Population growth since 2017: 0.54% (Census Bureau – U.S. average is 0.62%)
- Population growth since 2010: 8.01% (Census Bureau – U.S. average is 5.96%)
- 5-year projected population growth: 0.7% (PwC/ULI – U.S. average is 0.7%)
San Diego Rental Market
- Median 1-bedroom rent: $1,578 (Rentonomics – U.S. average is $961)
- Median 2-bedroom rent: $2,047 (Rentonomics – U.S. average is $1,192)
- Year-over-year rent growth: 1.2% (Rentonomics – U.S. average is 1.4%)
- Vacancy rate: 4.5% (Census Bureau – U.S. metropolitan average is 6.7%)
- Percentage of residents who rent their homes: 43.9% (Census Bureau – U.S. metropolitan average is 37.1%)
- Rent list price per square foot: $2.38 (Zillow – U.S. average is $1.14)
- Rental breakeven horizon: 3.2 years (Zillow – U.S. average is 2.0, meaning that buying is more financially advantageous than renting after 2 years)
- Rent to cost of ownership ratio: 0.4 (PwC/ULI – U.S. average is 0.8, meaning that the average rent payment in the area is 20% lower than a mortgage payment)
- Rent as % of household income: 26.4% (PwC/ULI – U.S. average is 33.4%, below 30% is considered ideal)
San Diego Housing Market
- Median home value: $645,489 (Zillow – U.S. average is $243,225)
- Year-over-year home value growth: 1.9% (Zillow – U.S. average is 3.8%)
- 1-year projected home value growth: 1.7% (Zillow – U.S. average is 2.2%)
- Median list price per square foot: $476 (Zillow – U.S. average is $154)
- Home affordability index: 64.2 (PwC/ULI – U.S. average is 153.0, meaning a resident making the median salary can afford to buy a median-priced home in the area 1.53 times over)
San Diego Economy
- 5-year projected employment growth: 0.8% (PwC/ULI – U.S. average is 0.6%)
- Cost of living index: 140.1 (City Data – U.S. average is 100)
- Cost of doing business index: 120.7 (PwC/ULI – U.S. average is 100)
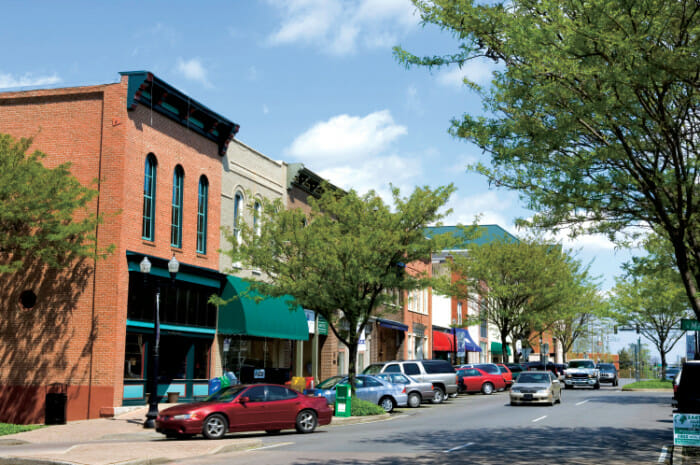
#69: Murfreesboro, Tennessee
- Metropolitan statistical area: Nashville-Davidson-Murfreesboro-Franklin, TN
- Cost of living index: 88.4 (City Data – U.S. average is 100)
Murfreesboro Population Growth
- Population: 141,344 (Census Bureau – 2018 estimate)
- Population growth since 2017: 1.60% (Census Bureau – U.S. average is 0.62%)
- Population growth since 2010: 15.57% (Census Bureau – U.S. average is 5.96%)
Murfreesboro Rental Market
- Vacancy rate: 7.5% (Census Bureau – U.S. metropolitan average is 6.7%)
- Percentage of residents who rent their homes: 31.7% (Census Bureau – U.S. metropolitan average is 37.1%)
- Rent list price per square foot: $0.94 (Zillow – U.S. average is $1.14)
- Rental breakeven horizon: 2.1 years (Zillow – U.S. average is 2.0, meaning that buying is more financially advantageous than renting after 2 years)
Murfreesboro Housing Market
- Median home value: $266,248 (Zillow – U.S. average is $243,225)
- Year-over-year home value growth: 3.4% (Zillow – U.S. average is 3.8%)
- 1-year projected home value growth: 3.2% (Zillow – U.S. average is 2.2%)
- Median list price per square foot: $141 (Zillow – U.S. average is $154)

#70: Salem, Oregon
- Metropolitan statistical area: Salem, OR
- Cost of living index: 94.8 (City Data – U.S. average is 100)
Salem, OR Population Growth
- Population: 173,442 (Census Bureau – 2018 estimate)
- Population growth since 2017: 1.68% (Census Bureau – U.S. average is 0.62%)
- Population growth since 2010: 10.58% (Census Bureau – U.S. average is 5.96%)
Salem, OR Housing Market
- Median home value: $287,862 (Zillow – U.S. average is $243,225)
- Year-over-year home value growth: 3.1% (Zillow – U.S. average is 3.8%)
- 1-year projected home value growth: 0.5% (Zillow – U.S. average is 2.2%)
- Median list price per square foot: $191 (Zillow – U.S. average is $154)
Salem, OR Rental Market
- Rent list price per square foot: $1.13 (Zillow – U.S. average is $1.14)
- Rental breakeven horizon: 1.9 years (Zillow – U.S. average is 2.0, meaning that buying is more financially advantageous than renting after 2 years)

#71: Buffalo, New York
- Metropolitan statistical area: Buffalo-Cheektowaga, NY
Buffalo Population Growth
- Population: 256,304 (Census Bureau – 2018 estimate)
- Population growth since 2017: 0.04% (Census Bureau – U.S. average is 0.62%)
- Population growth since 2010: -0.48% (Census Bureau – U.S. average is 5.96%)
- 5-year projected population growth: -0.3% (PwC/ULI – U.S. average is 0.7%)
Buffalo Rental Market
- Median 1-bedroom rent: $721 (Rentonomics – U.S. average is $961)
- Median 2-bedroom rent: $876 (Rentonomics – U.S. average is $1,192)
- Year-over-year rent growth: 0.8% (Rentonomics – U.S. average is 1.4%)
- Vacancy rate: 6.9% (Census Bureau – U.S. metropolitan average is 6.7%)
- Percentage of residents who rent their homes: 36.9% (Census Bureau – U.S. metropolitan average is 37.1%)
- Rent list price per square foot: $0.91 (Zillow – U.S. average is $1.14)
- Rental breakeven horizon: 10 months (Zillow – U.S. average is 2.0, meaning that buying is more financially advantageous than renting after 2 years)
- Rent to cost of ownership ratio: 0.9 (PwC/ULI – U.S. average is 0.8, meaning that the average rent payment in the area is 20% lower than a mortgage payment)
- Rent as % of household income: 18.6% (PwC/ULI – U.S. average is 33.4%, below 30% is considered ideal)
Buffalo Housing Market
- Median home value: $103,157 (Zillow – U.S. average is $243,225)
- Year-over-year home value growth: 9.7% (Zillow – U.S. average is 3.8%)
- 1-year projected home value growth: 5.3% (Zillow – U.S. average is 2.2%)
- Median list price per square foot: $80 (Zillow – U.S. average is $154)
- Home affordability index: 243.4 (PwC/ULI – U.S. average is 153.0, meaning a resident making the median salary can afford to buy a median-priced home in the area 1.53 times over)
Buffalo Economy
- 5-year projected employment growth: -0.2% (PwC/ULI – U.S. average is 0.6%)
- Cost of living index: 101.2 (City Data – U.S. average is 100)
- Cost of doing business index: 98.4 (PwC/ULI – U.S. average is 100)

#72: Tallahassee, Florida
- Metropolitan statistical area: Tallahassee, FL
Tallahassee Population Growth
- Population: 193,551 (Census Bureau – 2018 estimate)
- Population growth since 2017: 0.44% (Census Bureau – U.S. average is 0.62%)
- Population growth since 2010: 4.44% (Census Bureau – U.S. average is 5.96%)
- 5-year projected population growth: 0.7% (PwC/ULI – U.S. average is 0.7%)
Tallahassee Rental Market
- Median 1-bedroom rent: $819 (Rentonomics – U.S. average is $961)
- Median 2-bedroom rent: $1,014 (Rentonomics – U.S. average is $1,192)
- Year-over-year rent growth: 1.0% (Rentonomics – U.S. average is 1.4%)
- Rent list price per square foot: $0.94 (Zillow – U.S. average is $1.14)
- Rental breakeven horizon: 2.5 years (Zillow – U.S. average is 2.0, meaning that buying is more financially advantageous than renting after 2 years)
- Rent to cost of ownership ratio: 0.7 (PwC/ULI – U.S. average is 0.8, meaning that the average rent payment in the area is 20% lower than a mortgage payment)
- Rent as % of household income: 21.5% (PwC/ULI – U.S. average is 33.4%, below 30% is considered ideal)
Tallahassee Housing Market
- Median home value: $191,147 (Zillow – U.S. average is $243,225)
- Year-over-year home value growth: 2.4% (Zillow – U.S. average is 3.8%)
- 1-year projected home value growth: 1.5% (Zillow – U.S. average is 2.2%)
- Median list price per square foot: $134 (Zillow – U.S. average is $154)
- Home affordability index: 192.1 (PwC/ULI – U.S. average is 153.0, meaning a resident making the median salary can afford to buy a median-priced home in the area 1.53 times over)
Tallahassee Economy
- 5-year projected employment growth: 0.8% (PwC/ULI – U.S. average is 0.6%)
- Cost of living index: 89.7 (City Data – U.S. average is 100)
- Cost of doing business index: 96.5 (PwC/ULI – U.S. average is 100)

#73: San Bernardino, California
- Metropolitan statistical area: Riverside-San Bernardino-Ontario, CA
San Bernardino Population Growth
- Population: 215,941 (Census Bureau – 2018 estimate)
- Population growth since 2017: 1.14% (Census Bureau – U.S. average is 0.62%)
- Population growth since 2010: 9.41% (Census Bureau – U.S. average is 5.96%)
- 5-year projected population growth: 1.4% (PwC/ULI – U.S. average is 0.7%)
San Bernardino Rental Market
- Median 1-bedroom rent: $854 (Rentonomics – U.S. average is $961)
- Median 2-bedroom rent: $1,068 (Rentonomics – U.S. average is $1,192)
- Year-over-year rent growth: 0.4% (Rentonomics – U.S. average is 1.4%)
- Vacancy rate: 5.1% (Census Bureau – U.S. metropolitan average is 6.7%)
- Percentage of residents who rent their homes: 37.7% (Census Bureau – U.S. metropolitan average is 37.1%)
- Rent list price per square foot: $1.32 (Zillow – U.S. average is $1.14)
- Rental breakeven horizon: 1.7 years (Zillow – U.S. average is 2.0, meaning that buying is more financially advantageous than renting after 2 years)
- Rent to cost of ownership ratio: 0.6 (PwC/ULI – U.S. average is 0.8, meaning that the average rent payment in the area is 20% lower than a mortgage payment)
- Rent as % of household income: 24.8% (PwC/ULI – U.S. average is 33.4%, below 30% is considered ideal)
San Bernardino Housing Market
- Median home value: $305,861 (Zillow – U.S. average is $243,225)
- Year-over-year home value growth: 4.7% (Zillow – U.S. average is 3.8%)
- 1-year projected home value growth: 3.7% (Zillow – U.S. average is 2.2%)
- Median list price per square foot: $217 (Zillow – U.S. average is $154)
- Home affordability index: 91.5 (PwC/ULI – U.S. average is 153.0, meaning a resident making the median salary can afford to buy a median-priced home in the area 1.53 times over)
San Bernardino Economy
- 5-year projected employment growth: 1.3% (PwC/ULI – U.S. average is 0.6%)
- Cost of living index: 81.6 (City Data – U.S. average is 100)
- Cost of doing business index: 109.4 (PwC/ULI – U.S. average is 100)

#74: Birmingham, Alabama
- Metropolitan statistical area: Birmingham-Hoover, AL
Birmingham, AL Population Growth
- Population: 209,880 (Census Bureau – 2018 estimate)
- Population growth since 2017: 0.18% (Census Bureau – U.S. average is 0.62%)
- Population growth since 2010: 2.10% (Census Bureau – U.S. average is 5.96%)
- 5-year projected population growth: 0.3% (PwC/ULI – U.S. average is 0.7%)
Birmingham, AL Rental Market
- Median 1-bedroom rent: $834 (Rentonomics – U.S. average is $961)
- Median 2-bedroom rent: $966 (Rentonomics – U.S. average is $1,192)
- Year-over-year rent growth: 1.8% (Rentonomics – U.S. average is 1.4%)
- Vacancy rate: 11.9% (Census Bureau – U.S. metropolitan average is 6.7%)
- Percentage of residents who rent their homes: 34.1% (Census Bureau – U.S. metropolitan average is 37.1%)
- Rent list price per square foot: $0.74 (Zillow – U.S. average is $1.14)
- Rent to cost of ownership ratio: 0.6 (PwC/ULI – U.S. average is 0.8, meaning that the average rent payment in the area is 20% lower than a mortgage payment)
- Rent as % of household income: 18.7% (PwC/ULI – U.S. average is 33.4%, below 30% is considered ideal)
Birmingham, AL Housing Market
- Median home value: $61,731 (Zillow – U.S. average is $243,225)
- Year-over-year home value growth: 7.6% (Zillow – U.S. average is 3.8%)
- 1-year projected home value growth: 2.1% (Zillow – U.S. average is 2.2%)
- Median list price per square foot: $70 (Zillow – U.S. average is $154)
- Home affordability index: 158.2 (PwC/ULI – U.S. average is 153.0, meaning a resident making the median salary can afford to buy a median-priced home in the area 1.53 times over)
Birmingham, AL Economy
- 5-year projected employment growth: 0.4% (PwC/ULI – U.S. average is 0.6%)
- Cost of living index: 86.7 (City Data – U.S. average is 100)
- Cost of doing business index: 88.8 (PwC/ULI – U.S. average is 100)
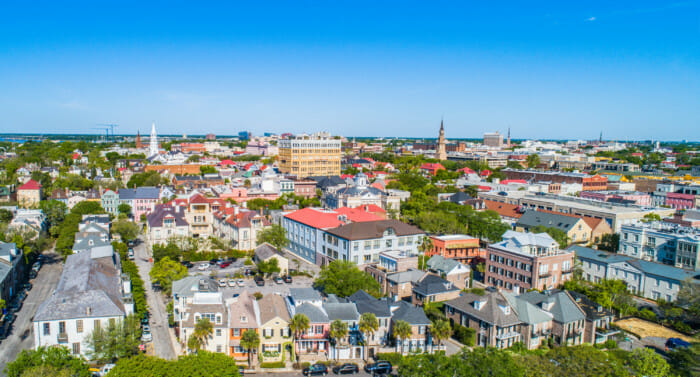
#75: North Charleston, South Carolina
- Metropolitan statistical area: Charleston-North Charleston, SC
- Cost of living index: 92.6 (City Data – U.S. average is 100)
North Charleston Population Growth
- Population: 113,237 (Census Bureau – 2018 estimate)
- Population growth since 2017: 1.62% (Census Bureau – U.S. average is 0.62%)
- Population growth since 2010: 18.51% (Census Bureau – U.S. average is 5.96%)
North Charleston Rental Market
- Median 1-bedroom rent: $931 (Rentonomics – U.S. average is $961)
- Median 2-bedroom rent: $1,108 (Rentonomics – U.S. average is $1,192)
- Year-over-year rent growth: 2.6% (Rentonomics – U.S. average is 1.4%)
- Vacancy rate: 17.0% (Census Bureau – U.S. metropolitan average is 6.7%)
- Percentage of residents who rent their homes: 31.2% (Census Bureau – U.S. metropolitan average is 37.1%)
- Rent list price per square foot: $1.02 (Zillow – U.S. average is $1.14)
- Rental breakeven horizon: 1.5 years (Zillow – U.S. average is 2.0, meaning that buying is more financially advantageous than renting after 2 years)
North Charleston Housing Market
- Median home value: $183,242 (Zillow – U.S. average is $243,225)
- Year-over-year home value growth: 4.6% (Zillow – U.S. average is 3.8%)
- 1-year projected home value growth: 2.5% (Zillow – U.S. average is 2.2%)
- Median list price per square foot: $129 (Zillow – U.S. average is $154)

#76: Jersey City, New Jersey
- Metropolitan statistical area: New York-Newark-Jersey City, NY-NJ-PA
Jersey City Population Growth
- Population: 265,549 (Census Bureau – 2018 estimate)
- Population growth since 2017: -0.10% (Census Bureau – U.S. average is 0.62%)
- Population growth since 2010: 2.11% (Census Bureau – U.S. average is 5.96%)
- 5-year projected population growth: 0.6% (PwC/ULI – U.S. average is 0.7%)
Jersey City Rental Market
- Median 1-bedroom rent: $1,607 (Rentonomics – U.S. average is $961)
- Median 2-bedroom rent: $1,914 (Rentonomics – U.S. average is $1,192)
- Year-over-year rent growth: 0.9% (Rentonomics – U.S. average is 1.4%)
- Vacancy rate: 4.5% (Census Bureau – U.S. metropolitan average is 6.7%)
- Percentage of residents who rent their homes: 50.3% (Census Bureau – U.S. metropolitan average is 37.1%)
- Rent list price per square foot: $1.95 (Zillow – U.S. average is $1.14)
- Rent to cost of ownership ratio: 0.8 (PwC/ULI – U.S. average is 0.8, meaning that the average rent payment in the area is 20% lower than a mortgage payment)
- Rent as % of household income: 14.4% (PwC/ULI – U.S. average is 33.4%, below 30% is considered ideal)
Jersey City Housing Market
- Median home value: $493,514 (Zillow – U.S. average is $243,225)
- Year-over-year home value growth: 2.0% (Zillow – U.S. average is 3.8%)
- 1-year projected home value growth: 0% (Zillow – U.S. average is 2.2%)
- Median list price per square foot: $435 (Zillow – U.S. average is $154)
- Home affordability index: 88.1 (PwC/ULI – U.S. average is 153.0, meaning a resident making the median salary can afford to buy a median-priced home in the area 1.53 times over)
Jersey City Economy
- 5-year projected employment growth: 0.4% (PwC/ULI – U.S. average is 0.6%)
- Cost of living index: 123.6 (City Data – U.S. average is 100)
- Cost of doing business index: 118.0 (PwC/ULI – U.S. average is 100)

#77: Oakland, California
- Metropolitan statistical area: San Francisco-Oakland-Berkeley, CA
Oakland Population Growth
- Population: 429,082 (Census Bureau – 2018 estimate)
- Population growth since 2017: 0.40% (Census Bureau – U.S. average is 0.62%)
- Population growth since 2010: 9.09% (Census Bureau – U.S. average is 5.96%)
- 5-year projected population growth: 0.8% (PwC/ULI – U.S. average is 0.7%)
Oakland Rental Market
- Vacancy rate: 5.4% (Census Bureau – U.S. metropolitan average is 6.7%)
- Percentage of residents who rent their homes: 44.4% (Census Bureau – U.S. metropolitan average is 37.1%)
- Rent list price per square foot: $2.67 (Zillow – U.S. average is $1.14)
- Rental breakeven horizon: 2.5 years (Zillow – U.S. average is 2.0, meaning that buying is more financially advantageous than renting after 2 years)
- Rent to cost of ownership ratio: 0.4 (PwC/ULI – U.S. average is 0.8, meaning that the average rent payment in the area is 20% lower than a mortgage payment)
- Rent as % of household income: 26.4% (PwC/ULI – U.S. average is 33.4%, below 30% is considered ideal)
Oakland Housing Market
- Median home value: $752,275 (Zillow – U.S. average is $243,225)
- Year-over-year home value growth: 0.3% (Zillow – U.S. average is 3.8%)
- 1-year projected home value growth: -0.3% (Zillow – U.S. average is 2.2%)
- Median list price per square foot: $529 (Zillow – U.S. average is $154)
- Home affordability index: 64.9 (PwC/ULI – U.S. average is 153.0, meaning a resident making the median salary can afford to buy a median-priced home in the area 1.53 times over)
Oakland Economy
- 5-year projected employment growth: 0.8% (PwC/ULI – U.S. average is 0.6%)
- Cost of living index: 156.1 (City Data – U.S. average is 100)
- Cost of doing business index: 120.0 (PwC/ULI – U.S. average is 100)

#78: St. Louis, Missouri
- Metropolitan statistical area: St. Louis, MO-IL
St. Louis Population Growth
- Population: 302,838 (Census Bureau – 2018 estimate)
- Population growth since 2017: -0.01% (Census Bureau – U.S. average is 0.62%)
- Population growth since 2010: 0.64% (Census Bureau – U.S. average is 5.96%)
- 5-year projected population growth: 0.1% (PwC/ULI – U.S. average is 0.7%)
St. Louis Rental Market
- Median 1-bedroom rent: $723 (Rentonomics – U.S. average is $961)
- Median 2-bedroom rent: $939 (Rentonomics – U.S. average is $1,192)
- Year-over-year rent growth: 0.7% (Rentonomics – U.S. average is 1.4%)
- Vacancy rate: 7.4% (Census Bureau – U.S. metropolitan average is 6.7%)
- Percentage of residents who rent their homes: 34.2% (Census Bureau – U.S. metropolitan average is 37.1%)
- Rent list price per square foot: $0.94 (Zillow – U.S. average is $1.14)
- Rental breakeven horizon: 1.4 years (Zillow – U.S. average is 2.0, meaning that buying is more financially advantageous than renting after 2 years)
- Rent to cost of ownership ratio: 0.7 (PwC/ULI – U.S. average is 0.8, meaning that the average rent payment in the area is 20% lower than a mortgage payment)
- Rent as % of household income: 16.8% (PwC/ULI – U.S. average is 33.4%, below 30% is considered ideal)
St. Louis Housing Market
- Median home value: $124,919 (Zillow – U.S. average is $243,225)
- Year-over-year home value growth: 1.9% (Zillow – U.S. average is 3.8%)
- 1-year projected home value growth: 1.7% (Zillow – U.S. average is 2.2%)
- Median list price per square foot: $125 (Zillow – U.S. average is $154)
- Home affordability index: 208.7 (PwC/ULI – U.S. average is 153.0, meaning a resident making the median salary can afford to buy a median-priced home in the area 1.53 times over)
St. Louis Economy
- 5-year projected employment growth: 0.2% (PwC/ULI – U.S. average is 0.6%)
- Cost of living index: 88.7 (City Data – U.S. average is 100)
- Cost of doing business index: 93.1 (PwC/ULI – U.S. average is 100)

#79: Palm Bay, Florida
- Metropolitan statistical area: Palm Bay-Melbourne-Titusville, FL
- Cost of living index: 89.1 (City Data – U.S. average is 100)
Palm Bay Population Growth
- Population: 114,194 (Census Bureau – 2018 estimate)
- Population growth since 2017: 1.46% (Census Bureau – U.S. average is 0.62%)
- Population growth since 2010: 9.84% (Census Bureau – U.S. average is 5.96%)
Palm Bay Rental Market
- Median 1-bedroom rent: $831 (Rentonomics – U.S. average is $961)
- Median 2-bedroom rent: $1,053 (Rentonomics – U.S. average is $1,192)
- Year-over-year rent growth: 0.7% (Rentonomics – U.S. average is 1.4%)
- Rent list price per square foot: $0.74 (Zillow – U.S. average is $1.14)
- Rental breakeven horizon: 1.3 years (Zillow – U.S. average is 2.0, meaning that buying is more financially advantageous than renting after 2 years)
Palm Bay Housing Market
- Median home value: $186,152 (Zillow – U.S. average is $243,225)
- Year-over-year home value growth: 3.3% (Zillow – U.S. average is 3.8%)
- 1-year projected home value growth: 2.0% (Zillow – U.S. average is 2.2%)
- Median list price per square foot: $95 (Zillow – U.S. average is $154)

#80: West Palm Beach, Florida
- Metropolitan statistical area: Miami-Fort Lauderdale-Pompano Beach, FL
West Palm Beach Population Growth
- Population: 111,398 (Census Bureau – 2018 estimate)
- Population growth since 2017: 1.06% (Census Bureau – U.S. average is 0.62%)
- Population growth since 2010: 12.56% (Census Bureau – U.S. average is 5.96%)
- 5-year projected population growth: 1.1% (PwC/ULI – U.S. average is 0.7%)
West Palm Beach Rental Market
- Median 1-bedroom rent: $1,103 (Rentonomics – U.S. average is $961)
- Median 2-bedroom rent: $1,398 (Rentonomics – U.S. average is $1,192)
- Year-over-year rent growth: 1.5% (Rentonomics – U.S. average is 1.4%)
- Rent list price per square foot: $1.53 (Zillow – U.S. average is $1.14)
- Rental breakeven horizon: 1.6 years (Zillow – U.S. average is 2.0, meaning that buying is more financially advantageous than renting after 2 years)
- Rent to cost of ownership ratio: 0.7 (PwC/ULI – U.S. average is 0.8, meaning that the average rent payment in the area is 20% lower than a mortgage payment)
- Rent as % of household income: 28.7% (PwC/ULI – U.S. average is 33.4%, below 30% is considered ideal)
West Palm Beach Housing Market
- Median home value: $249,975 (Zillow – U.S. average is $243,225)
- Year-over-year home value growth: 2.9% (Zillow – U.S. average is 3.8%)
- 1-year projected home value growth: 2.1% (Zillow – U.S. average is 2.2%)
- Median list price per square foot: $203 (Zillow – U.S. average is $154)
- Home affordability index: 112.5 (PwC/ULI – U.S. average is 153.0, meaning a resident making the median salary can afford to buy a median-priced home in the area 1.53 times over)
West Palm Beach Economy
- 5-year projected employment growth: 1.2% (PwC/ULI – U.S. average is 0.6%)
- Cost of living index: 101.5 (City Data – U.S. average is 100)
- Cost of doing business index: 111.2 (PwC/ULI – U.S. average is 100)

#81: Irving, Texas
- Metropolitan statistical area: Dallas-Fort Worth-Arlington, TX
- Cost of living index: 94.6 (City Data – U.S. average is 100)
Irving, TX Population Growth
- Population: 242,242 (Census Bureau – 2018 estimate)
- Population growth since 2017: 1.84% (Census Bureau – U.S. average is 0.62%)
- Population growth since 2010: 18.40% (Census Bureau – U.S. average is 5.96%)
Irving, TX Rental Market
- Median 1-bedroom rent: $998 (Rentonomics – U.S. average is $961)
- Median 2-bedroom rent: $1,240 (Rentonomics – U.S. average is $1,192)
- Year-over-year rent growth: 1.9% (Rentonomics – U.S. average is 1.4%)
- Rent list price per square foot: $1.07 (Zillow – U.S. average is $1.14)
- Rental breakeven horizon: 1.4 years (Zillow – U.S. average is 2.0, meaning that buying is more financially advantageous than renting after 2 years)
Irving, TX Housing Market
- Median home value: $232,297 (Zillow – U.S. average is $243,225)
- Year-over-year home value growth: 5.6% (Zillow – U.S. average is 3.8%)
- 1-year projected home value growth: 2.1% (Zillow – U.S. average is 2.2%)
- Median list price per square foot: $155 (Zillow – U.S. average is $154)
Take a deeper dive into the Dallas-Fort Worth real estate market, as well as other cities in the region: South Central Real Estate Market Trends

#82: Chattanooga, Tennessee
- Metropolitan statistical area: Chattanooga, TN-GA
Chattanooga Population Growth
- Population: 180,557 (Census Bureau – 2018 estimate)
- Population growth since 2017: 0.85% (Census Bureau – U.S. average is 0.62%)
- Population growth since 2010: 6.18% (Census Bureau – U.S. average is 5.96%)
- 5-year projected population growth: 0.6% (PwC/ULI – U.S. average is 0.7%)
Chattanooga Rental Market
- Median 1-bedroom rent: $747 (Rentonomics – U.S. average is $961)
- Median 2-bedroom rent: $929 (Rentonomics – U.S. average is $1,192)
- Year-over-year rent growth: 2.7% (Rentonomics – U.S. average is 1.4%)
- Rent list price per square foot: $1.02 (Zillow – U.S. average is $1.14)
- Rental breakeven horizon: 1.3 years (Zillow – U.S. average is 2.0, meaning that buying is more financially advantageous than renting after 2 years)
- Rent to cost of ownership ratio: 0.7 (PwC/ULI – U.S. average is 0.8, meaning that the average rent payment in the area is 20% lower than a mortgage payment)
- Rent as % of household income: 17.9% (PwC/ULI – U.S. average is 33.4%, below 30% is considered ideal)
Chattanooga Housing Market
- Median home value: $166,748 (Zillow – U.S. average is $243,225)
- Year-over-year home value growth: 6.2% (Zillow – U.S. average is 3.8%)
- 1-year projected home value growth: 3.2% (Zillow – U.S. average is 2.2%)
- Median list price per square foot: $146 (Zillow – U.S. average is $154)
- Home affordability index: 191.3 (PwC/ULI – U.S. average is 153.0, meaning a resident making the median salary can afford to buy a median-priced home in the area 1.53 times over)
Chattanooga Economy
- 5-year projected employment growth: 0.4% (PwC/ULI – U.S. average is 0.6%)
- Cost of living index: 88.7 (City Data – U.S. average is 100)
- Cost of doing business index: 90.0 (PwC/ULI – U.S. average is 100)

#83: Houston, Texas
- Metropolitan statistical area: Houston-The Woodlands-Sugar Land, TX
Houston Population Growth
- Population: 2,325,502 (Census Bureau – 2018 estimate)
- Population growth since 2017: 1.33% (Census Bureau – U.S. average is 0.62%)
- Population growth since 2010: 18.19% (Census Bureau – U.S. average is 5.96%)
- 5-year projected population growth: 1.6% (PwC/ULI – U.S. average is 0.7%)
Houston Rental Market
- Median 1-bedroom rent: $844 (Rentonomics – U.S. average is $961)
- Median 2-bedroom rent: $1,032 (Rentonomics – U.S. average is $1,192)
- Year-over-year rent growth: 0.6% (Rentonomics – U.S. average is 1.4%)
- Vacancy rate: 8.8% (Census Bureau – U.S. metropolitan average is 6.7%)
- Percentage of residents who rent their homes: 39.9% (Census Bureau – U.S. metropolitan average is 37.1%)
- Rent list price per square foot: $1.02 (Zillow – U.S. average is $1.14)
- Rental breakeven horizon: 1.6 years (Zillow – U.S. average is 2.0, meaning that buying is more financially advantageous than renting after 2 years)
- Rent to cost of ownership ratio: 0.7 (PwC/ULI – U.S. average is 0.8, meaning that the average rent payment in the area is 20% lower than a mortgage payment)
- Rent as % of household income: 18.2% (PwC/ULI – U.S. average is 33.4%, below 30% is considered ideal)
Houston Housing Market
- Median home value: $189,790 (Zillow – U.S. average is $243,225)
- Year-over-year home value growth: 3.8% (Zillow – U.S. average is 3.8%)
- 1-year projected home value growth: 2.0% (Zillow – U.S. average is 2.2%)
- Median list price per square foot: $142 (Zillow – U.S. average is $154)
- Home affordability index: 161.7 (PwC/ULI – U.S. average is 153.0, meaning a resident making the median salary can afford to buy a median-priced home in the area 1.53 times over)
Houston Economy
- 5-year projected employment growth: 1.4% (PwC/ULI – U.S. average is 0.6%)
- Cost of living index: 93.5 (City Data – U.S. average is 100)
- Cost of doing business index: 102.7 (PwC/ULI – U.S. average is 100)
Take a deeper dive into the Houston real estate market, as well as other cities in the region: South Central Real Estate Market Trends

#84: Reno, Nevada
- Metropolitan statistical area: Reno, NV
- Cost of living index: 98.1 (City Data – U.S. average is 100)
Reno Population Growth
- Population: 250,998 (Census Bureau – 2018 estimate)
- Population growth since 2017: 1.83% (Census Bureau – U.S. average is 0.62%)
- Population growth since 2010: 10.42% (Census Bureau – U.S. average is 5.96%)
Reno Rental Market
- Median 1-bedroom rent: $896 (Rentonomics – U.S. average is $961)
- Median 2-bedroom rent: $1,167 (Rentonomics – U.S. average is $1,192)
- Year-over-year rent growth: 0.9% (Rentonomics – U.S. average is 1.4%)
- Rent list price per square foot: $1.21 (Zillow – U.S. average is $1.14)
- Rental breakeven horizon: 2.0 years (Zillow – U.S. average is 2.0, meaning that buying is more financially advantageous than renting after 2 years)
Reno Housing Market
- Median home value: $385,640 (Zillow – U.S. average is $243,225)
- Year-over-year home value growth: 1.9% (Zillow – U.S. average is 3.8%)
- 1-year projected home value growth: 2.3% (Zillow – U.S. average is 2.2%)
- Median list price per square foot: $228 (Zillow – U.S. average is $154)

#85: El Paso, Texas
- Metropolitan statistical area: El Paso, TX
- Cost of living index: 82.6 (City Data – U.S. average is 100)
El Paso Population Growth
- Population: 682,669 (Census Bureau – 2018 estimate)
- Population growth since 2017: 0.05% (Census Bureau – U.S. average is 0.62%)
- Population growth since 2010: 5.15% (Census Bureau – U.S. average is 5.96%)
El Paso Rental Market
- Median 1-bedroom rent: $696 (Rentonomics – U.S. average is $961)
- Median 2-bedroom rent: $847 (Rentonomics – U.S. average is $1,192)
- Year-over-year rent growth: 1.3% (Rentonomics – U.S. average is 1.4%)
- Rent list price per square foot: $0.78 (Zillow – U.S. average is $1.14)
- Rental breakeven horizon: 2.4 years (Zillow – U.S. average is 2.0, meaning that buying is more financially advantageous than renting after 2 years)
El Paso Housing Market
- Median home value: $133,856 (Zillow – U.S. average is $243,225)
- Year-over-year home value growth: 3.3% (Zillow – U.S. average is 3.8%)
- 1-year projected home value growth: -1.4% (Zillow – U.S. average is 2.2%)
- Median list price per square foot: $102 (Zillow – U.S. average is $154)

#86: Vancouver, Washington
- Metropolitan statistical area: Portland-Vancouver-Hillsboro, OR-WA
- Cost of living index: 102.8 (City Data – U.S. average is 100)
Vancouver, WA Population Growth
- Population: 183,012 (Census Bureau – 2018 estimate)
- Population growth since 2017: 0.91% (Census Bureau – U.S. average is 0.62%)
- Population growth since 2010: 11.36% (Census Bureau – U.S. average is 5.96%)
Vancouver, WA Rental Market
- Median 1-bedroom rent: $1,420 (Rentonomics – U.S. average is $961)
- Median 2-bedroom rent: $1,676 (Rentonomics – U.S. average is $1,192)
- Year-over-year rent growth: 1.5% (Rentonomics – U.S. average is 1.4%)
- Vacancy rate: 3.8% (Census Bureau – U.S. metropolitan average is 6.7%)
- Percentage of residents who rent their homes: 40.8% (Census Bureau – U.S. metropolitan average is 37.1%)
- Rent list price per square foot: $1.14 (Zillow – U.S. average is $1.14)
- Rental breakeven horizon: 2.6 years (Zillow – U.S. average is 2.0, meaning that buying is more financially advantageous than renting after 2 years)
Vancouver, WA Housing Market
- Median home value: $352,393 (Zillow – U.S. average is $243,225)
- Year-over-year home value growth: 3.3% (Zillow – U.S. average is 3.8%)
- 1-year projected home value growth: 2.9% (Zillow – U.S. average is 2.2%)
- Median list price per square foot: $211 (Zillow – U.S. average is $154)

#87: Louisville, Kentucky
- Metropolitan statistical area: Louisville-Jefferson County, KY-IN
Louisville Population Growth
- Population: 620,118 (Census Bureau – 2018 estimate)
- Population growth since 2017: 0.35% (Census Bureau – U.S. average is 0.62%)
- Population growth since 2010: 4.99% (Census Bureau – U.S. average is 5.96%)
- 5-year projected population growth: 0.6% (PwC/ULI – U.S. average is 0.7%)
Louisville Rental Market
- Median 1-bedroom rent: $663 (Rentonomics – U.S. average is $961)
- Median 2-bedroom rent: $838 (Rentonomics – U.S. average is $1,192)
- Year-over-year rent growth: 0.5% (Rentonomics – U.S. average is 1.4%)
- Vacancy rate: 7.7% (Census Bureau – U.S. metropolitan average is 6.7%)
- Percentage of residents who rent their homes: 32.1% (Census Bureau – U.S. metropolitan average is 37.1%)
- Rent list price per square foot: $0.98 (Zillow – U.S. average is $1.14)
- Rental breakeven horizon: 1.7 years (Zillow – U.S. average is 2.0, meaning that buying is more financially advantageous than renting after 2 years)
- Rent to cost of ownership ratio: 0.7 (PwC/ULI – U.S. average is 0.8, meaning that the average rent payment in the area is 20% lower than a mortgage payment)
- Rent as % of household income: 15.8% (PwC/ULI – U.S. average is 33.4%, below 30% is considered ideal)
Louisville Housing Market
- Median home value: $173,641 (Zillow – U.S. average is $243,225)
- Year-over-year home value growth: 4.1% (Zillow – U.S. average is 3.8%)
- 1-year projected home value growth: 3.1% (Zillow – U.S. average is 2.2%)
- Median list price per square foot: $138 (Zillow – U.S. average is $154)
- Home affordability index: 195.7 (PwC/ULI – U.S. average is 153.0, meaning a resident making the median salary can afford to buy a median-priced home in the area 1.53 times over)
Louisville Economy
- 5-year projected employment growth: 0.4% (PwC/ULI – U.S. average is 0.6%)
- Cost of living index: 93.5 (City Data – U.S. average is 100)
- Cost of doing business index: 91.4 (PwC/ULI – U.S. average is 100)

#88: Peoria, Arizona
- Metropolitan statistical area: Phoenix-Mesa-Chandler, AZ
- Population: 172,259 (Census Bureau – 2018 estimate)
- Cost of living index: 94.9 (City Data – U.S. average is 100)
Peoria, AZ Rental Market
- Median 1-bedroom rent: $1,180 (Rentonomics – U.S. average is $961)
- Median 2-bedroom rent: $1,470 (Rentonomics – U.S. average is $1,192)
- Year-over-year rent growth: 4.3% (Rentonomics – U.S. average is 1.4%)
- Rent list price per square foot: $0.91 (Zillow – U.S. average is $1.14)
- Rental breakeven horizon: 2.7 years (Zillow – U.S. average is 2.0, meaning that buying is more financially advantageous than renting after 2 years)
Peoria, AZ Housing Market
- Median home value: $300,791 (Zillow – U.S. average is $243,225)
- Year-over-year home value growth: 5.3% (Zillow – U.S. average is 3.8%)
- 1-year projected home value growth: 3.5% (Zillow – U.S. average is 2.2%)
- Median list price per square foot: $161 (Zillow – U.S. average is $154)
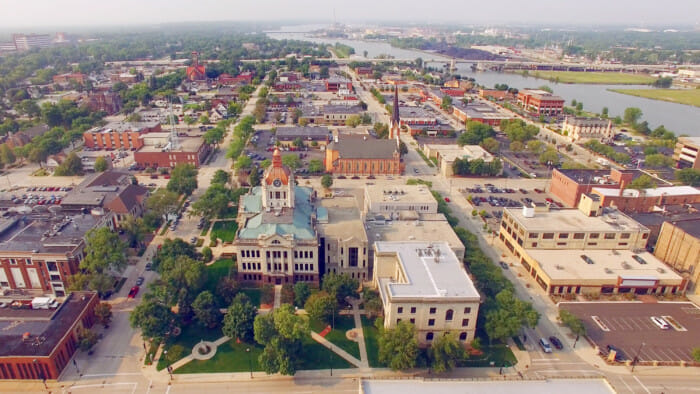
#89: Green Bay, Wisconsin
- Metropolitan statistical area: Green Bay, WI
- Cost of living index: 91.6 (City Data – U.S. average is 100)
Green Bay Population Growth
- Population: 104,879 (Census Bureau – 2018 estimate)
- Population growth since 2017: 0.56% (Census Bureau – U.S. average is 0.62%)
- Population growth since 2010: 5.01% (Census Bureau – U.S. average is 5.96%)
Green Bay Real Estate Market
- Median home value: $146,969 (Zillow – U.S. average is $243,225)
- Year-over-year home value growth: 5.5% (Zillow – U.S. average is 3.8%)
- 1-year projected home value growth: 1.9% (Zillow – U.S. average is 2.2%)
- Median list price per square foot: $111 (Zillow – U.S. average is $154)
- Rental breakeven horizon: 2.3 years (Zillow – U.S. average is 2.0, meaning that buying is more financially advantageous than renting after 2 years)

#90: Cedar Rapids, Iowa
- Metropolitan statistical area: Cedar Rapids, IA
- Cost of living index: 87.3 (City Data – U.S. average is 100)
Cedar Rapids Population Growth
- Population: 133,174 (Census Bureau – 2018 estimate)
- Population growth since 2017: 0.63% (Census Bureau – U.S. average is 0.62%)
- Population growth since 2010: 5.56% (Census Bureau – U.S. average is 5.96%)
Cedar Rapids Rental Market
- Median 1-bedroom rent: $676 (Rentonomics – U.S. average is $961)
- Median 2-bedroom rent: $893 (Rentonomics – U.S. average is $1,192)
- Year-over-year rent growth: -0.1% (Rentonomics – U.S. average is 1.4%)
- Rent list price per square foot: $0.96 (Zillow – U.S. average is $1.14)
- Rental breakeven horizon: 1.8 years (Zillow – U.S. average is 2.0, meaning that buying is more financially advantageous than renting after 2 years)
Cedar Rapids Housing Market
- Median home value: $144,243 (Zillow – U.S. average is $243,225)
- Year-over-year home value growth: 2.1% (Zillow – U.S. average is 3.8%)
- 1-year projected home value growth: 1.8% (Zillow – U.S. average is 2.2%)
- Median list price per square foot: $128 (Zillow – U.S. average is $154)

#91: Roswell, Georgia
- Metropolitan statistical area: Atlanta-Sandy Springs-Roswell, GA
- Cost of living index: 97.6 (City Data – U.S. average is 100)
Roswell, GA Population Growth
- Population: 94,650 (Census Bureau – 2018 estimate)
- Population growth since 2017: 1.29% (Census Bureau – U.S. average is 0.62%)
- Population growth since 2010: 12.54% (Census Bureau – U.S. average is 5.96%)
Roswell, GA Rental Market
- Median 1-bedroom rent: $1,272 (Rentonomics – U.S. average is $961)
- Median 2-bedroom rent: $1,469 (Rentonomics – U.S. average is $1,192)
- Year-over-year rent growth: 1.8% (Rentonomics – U.S. average is 1.4%)
- Vacancy rate: 6.6% (Census Bureau – U.S. metropolitan average is 6.7%)
- Percentage of residents who rent their homes: 36.0% (Census Bureau – U.S. metropolitan average is 37.1%)
- Rent list price per square foot: $1.03 (Zillow – U.S. average is $1.14)
- Rental breakeven horizon: 2.2 years (Zillow – U.S. average is 2.0, meaning that buying is more financially advantageous than renting after 2 years)
Roswell, GA Housing Market
- Median home value: $411,516 (Zillow – U.S. average is $243,225)
- Year-over-year home value growth: 0.8% (Zillow – U.S. average is 3.8%)
- 1-year projected home value growth: 0% (Zillow – U.S. average is 2.2%)
- Median list price per square foot: $175 (Zillow – U.S. average is $154)

#92: Portland, Maine
- Metropolitan statistical area: Portland-South Portland, ME
Portland, ME Population Growth
- Population: 66,417 (Census Bureau – 2018 estimate)
- Population growth since 2017: 0.59% (Census Bureau – U.S. average is 0.62%)
- Population growth since 2010: 4.15% (Census Bureau – U.S. average is 5.96%)
- 5-year projected population growth: 0.3% (PwC/ULI – U.S. average is 0.7%)
Portland, ME Rental Market
- Rent list price per square foot: $1.82 (Zillow – U.S. average is $1.14)
- Rental breakeven horizon: 2.6 years (Zillow – U.S. average is 2.0, meaning that buying is more financially advantageous than renting after 2 years)
- Rent to cost of ownership ratio: 0.7 (PwC/ULI – U.S. average is 0.8, meaning that the average rent payment in the area is 20% lower than a mortgage payment)
- Rent as % of household income: 21.4% (PwC/ULI – U.S. average is 33.4%, below 30% is considered ideal)
Portland, ME Housing Market
- Median home value: $331,397 (Zillow – U.S. average is $243,225)
- Year-over-year home value growth: 4.2% (Zillow – U.S. average is 3.8%)
- 1-year projected home value growth: 3.0% (Zillow – U.S. average is 2.2%)
- Median list price per square foot: $308 (Zillow – U.S. average is $154)
- Home affordability index: 147.3 (PwC/ULI – U.S. average is 153.0, meaning a resident making the median salary can afford to buy a median-priced home in the area 1.53 times over)
Portland, ME Economy
- 5-year projected employment growth: 0.2% (PwC/ULI – U.S. average is 0.6%)
- Cost of living index: 103.8 (City Data – U.S. average is 100)
- Cost of doing business index: 106.9 (PwC/ULI – U.S. average is 100)
Take a deep dive into the New England real estate market to learn what’s going on in Portland and other cities within the region: Boston Rental Market Trends

#93: Philadelphia, Pennsylvania
- Metropolitan statistical area: Philadelphia-Camden-Wilmington, PA-NJ-DE-MD
Philadelphia Population Growth
- Population: 1,584,138 (Census Bureau – 2018 estimate)
- Population growth since 2017: 0.24% (Census Bureau – U.S. average is 0.62%)
- Population growth since 2010: 3.08% (Census Bureau – U.S. average is 5.96%)
- 5-year projected population growth: 0.2% (PwC/ULI – U.S. average is 0.7%)
Philadelphia Rental Market
- Median 1-bedroom rent: $977 (Rentonomics – U.S. average is $961)
- Median 2-bedroom rent: $1,179 (Rentonomics – U.S. average is $1,192)
- Year-over-year rent growth: 0.4% (Rentonomics – U.S. average is 1.4%)
- Vacancy rate: 6.4% (Census Bureau – U.S. metropolitan average is 6.7%)
- Percentage of residents who rent their homes: 32.6% (Census Bureau – U.S. metropolitan average is 37.1%)
- Rent list price per square foot: $1.28 (Zillow – U.S. average is $1.14)
- Rental breakeven horizon: 1.3 years (Zillow – U.S. average is 2.0, meaning that buying is more financially advantageous than renting after 2 years)
- Rent to cost of ownership ratio: 0.8 (PwC/ULI – U.S. average is 0.8, meaning that the average rent payment in the area is 20% lower than a mortgage payment)
- Rent as % of household income: 22.5% (PwC/ULI – U.S. average is 33.4%, below 30% is considered ideal)
Philadelphia Housing Market
- Median home value: $182,238 (Zillow – U.S. average is $243,225)
- Year-over-year home value growth: 6.4% (Zillow – U.S. average is 3.8%)
- 1-year projected home value growth: 3.3% (Zillow – U.S. average is 2.2%)
- Median list price per square foot: $181 (Zillow – U.S. average is $154)
- Home affordability index: 176.5 (PwC/ULI – U.S. average is 153.0, meaning a resident making the median salary can afford to buy a median-priced home in the area 1.53 times over)
Philadelphia Economy
- 5-year projected employment growth: 0.3% (PwC/ULI – U.S. average is 0.6%)
- Cost of living index: 103.7 (City Data – U.S. average is 100)
- Cost of doing business index: 108.1 (PwC/ULI – U.S. average is 100)

#94: Winston-Salem, North Carolina
- Metropolitan statistical area: Winston-Salem, NC
- Cost of living index: 88.3 (City Data – U.S. average is 100)
Winston-Salem Population Growth
- Population: 246,328 (Census Bureau – 2018 estimate)
- Population growth since 2017: 0.71% (Census Bureau – U.S. average is 0.62%)
- Population growth since 2010: 4.83% (Census Bureau – U.S. average is 5.96%)
Winston-Salem Rental Market
- Median 1-bedroom rent: $672 (Rentonomics – U.S. average is $961)
- Median 2-bedroom rent: $820 (Rentonomics – U.S. average is $1,192)
- Year-over-year rent growth: 2.3% (Rentonomics – U.S. average is 1.4%)
- Rent list price per square foot: $0.84 (Zillow – U.S. average is $1.14)
- Rental breakeven horizon: 1.6 years (Zillow – U.S. average is 2.0, meaning that buying is more financially advantageous than renting after 2 years)
Winston-Salem Housing Market
- Median home value: $148,518 (Zillow – U.S. average is $243,225)
- Year-over-year home value growth: 6.8% (Zillow – U.S. average is 3.8%)
- 1-year projected home value growth: 4.8% (Zillow – U.S. average is 2.2%)
- Median list price per square foot: $113 (Zillow – U.S. average is $154)

#95: Akron, Ohio
- Metropolitan statistical area: Akron, OH
- Cost of living index: 95.7 (City Data – U.S. average is 100)
Akron Population Growth
- Population: 198,006 (Census Bureau – 2018 estimate)
- Population growth since 2017: 0.07% (Census Bureau – U.S. average is 0.62%)
- Population growth since 2010: 0.23% (Census Bureau – U.S. average is 5.96%)
Akron Rental Market
- Vacancy rate: 3.3% (Census Bureau – U.S. metropolitan average is 6.7%)
- Percentage of residents who rent their homes: 34.4% (Census Bureau – U.S. metropolitan average is 37.1%)
- Rent list price per square foot: $0.69 (Zillow – U.S. average is $1.14)
- Rental breakeven horizon: 0.8 years (Zillow – U.S. average is 2.0, meaning that buying is more financially advantageous than renting after 2 years)
Akron Housing Market
- Median home value: $72,575 (Zillow – U.S. average is $243,225)
- Year-over-year home value growth: 8.0% (Zillow – U.S. average is 3.8%)
- 1-year projected home value growth: 3.0% (Zillow – U.S. average is 2.2%)
- Median list price per square foot: $64 (Zillow – U.S. average is $154)

#96: Henderson, Nevada
- Metropolitan statistical area: Las Vegas-Henderson-Paradise, NV
- Cost of living index: 98.3 (City Data – U.S. average is 100)
Henderson Population Growth
- Population: 310,390 (Census Bureau – 2018 estimate)
- Population growth since 2017: 2.21% (Census Bureau – U.S. average is 0.62%)
- Population growth since 2010: 14.37% (Census Bureau – U.S. average is 5.96%)
Henderson Rental Market
- Median 1-bedroom rent: $1,127 (Rentonomics – U.S. average is $961)
- Median 2-bedroom rent: $1,397 (Rentonomics – U.S. average is $1,192)
- Year-over-year rent growth: 4.3% (Rentonomics – U.S. average is 1.4%)
- Vacancy rate: 6.8% (Census Bureau – U.S. metropolitan average is 6.7%)
- Percentage of residents who rent their homes: 41.9% (Census Bureau – U.S. metropolitan average is 37.1%)
- Rent list price per square foot: $0.99 (Zillow – U.S. average is $1.14)
- Rental breakeven horizon: 2.0 years (Zillow – U.S. average is 2.0, meaning that buying is more financially advantageous than renting after 2 years)
Henderson Housing Market
- Median home value: $335,791 (Zillow – U.S. average is $243,225)
- Year-over-year home value growth: 0.9% (Zillow – U.S. average is 3.8%)
- 1-year projected home value growth: 2.6% (Zillow – U.S. average is 2.2%)
- Median list price per square foot: $185 (Zillow – U.S. average is $154)

#97: Albuquerque, New Mexico
- Metropolitan statistical area: Albuquerque, NM
Albuquerque Population Growth
- Population: 560,218 (Census Bureau – 2018 estimate)
- Population growth since 2017: 0.33% (Census Bureau – U.S. average is 0.62%)
- Population growth since 2010: 3.25% (Census Bureau – U.S. average is 5.96%)
- 5-year projected population growth: 0.8% (PwC/ULI – U.S. average is 0.7%)
Albuquerque Rental Market
- Median 1-bedroom rent: $722 (Rentonomics – U.S. average is $961)
- Median 2-bedroom rent: $886 (Rentonomics – U.S. average is $1,192)
- Year-over-year rent growth: 1.9% (Rentonomics – U.S. average is 1.4%)
- Vacancy rate: 7.8% (Census Bureau – U.S. metropolitan average is 6.7%)
- Percentage of residents who rent their homes: 32.1% (Census Bureau – U.S. metropolitan average is 37.1%)
- Rent list price per square foot: $0.89 (Zillow – U.S. average is $1.14)
- Rental breakeven horizon: 3.6 years (Zillow – U.S. average is 2.0, meaning that buying is more financially advantageous than renting after 2 years)
- Rent to cost of ownership ratio: 0.6 (PwC/ULI – U.S. average is 0.8, meaning that the average rent payment in the area is 20% lower than a mortgage payment)
- Rent as % of household income: 18.8% (PwC/ULI – U.S. average is 33.4%, below 30% is considered ideal)
Albuquerque Housing Market
- Median home value: $208,544 (Zillow – U.S. average is $243,225)
- Year-over-year home value growth: 6.3% (Zillow – U.S. average is 3.8%)
- 1-year projected home value growth: 3.6% (Zillow – U.S. average is 2.2%)
- Median list price per square foot: $133 (Zillow – U.S. average is $154)
- Home affordability index: 145.3 (PwC/ULI – U.S. average is 153.0, meaning a resident making the median salary can afford to buy a median-priced home in the area 1.53 times over)
Albuquerque Economy
- 5-year projected employment growth: 0.9% (PwC/ULI – U.S. average is 0.6%)
- Cost of living index: 92.9 (City Data – U.S. average is 100)
- Cost of doing business index: 98.7 (PwC/ULI – U.S. average is 100)

#98: Denton, Texas
- Metropolitan statistical area: Dallas-Fort Worth-Arlington, TX
- Population: 138,541 (Census Bureau – 2018 estimate)
- Cost of living index: 95.0 (City Data – U.S. average is 100)
Denton Rental Market
- Median 1-bedroom rent: $870 (Rentonomics – U.S. average is $961)
- Median 2-bedroom rent: $1,081 (Rentonomics – U.S. average is $1,192)
- Year-over-year rent growth: 1.1% (Rentonomics – U.S. average is 1.4%)
- Rent list price per square foot: $1.03 (Zillow – U.S. average is $1.14)
- Rental breakeven horizon: 1.7 years (Zillow – U.S. average is 2.0, meaning that buying is more financially advantageous than renting after 2 years)
Denton Housing Market
- Median home value: $244,331 (Zillow – U.S. average is $243,225)
- Year-over-year home value growth: 1.9% (Zillow – U.S. average is 3.8%)
- 1-year projected home value growth: 1.2% (Zillow – U.S. average is 2.2%)
- Median list price per square foot: $136 (Zillow – U.S. average is $154)
Take a deeper dive into the Dallas-Fort Worth real estate market, as well as other cities in the region: South Central Real Estate Market Trends
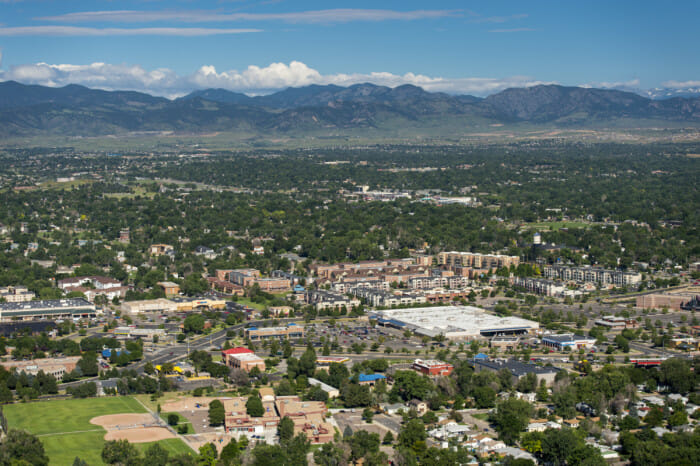
#99: Arvada, Colorado
- Metropolitan statistical area: Denver-Aurora-Lakewood, CO
- Population: 120,492 (Census Bureau – 2018 estimate)
- Cost of living index: 110.3 (City Data – U.S. average is 100)
Arvada Rental Market
- Median 1-bedroom rent: $1,246 (Rentonomics – U.S. average is $961)
- Median 2-bedroom rent: $1,578 (Rentonomics – U.S. average is $1,192)
- Year-over-year rent growth: 2.1% (Rentonomics – U.S. average is 1.4%)
- Rent list price per square foot: $1.55 (Zillow – U.S. average is $1.14)
- Rental breakeven horizon: 2.4 years (Zillow – U.S. average is 2.0, meaning that buying is more financially advantageous than renting after 2 years)
Arvada Housing Market
- Median home value: $440,589 (Zillow – U.S. average is $243,225)
- Year-over-year home value growth: 2.2% (Zillow – U.S. average is 3.8%)
- 1-year projected home value growth: 1.0% (Zillow – U.S. average is 2.2%)
- Median list price per square foot: $272 (Zillow – U.S. average is $154)

#100: Providence, Rhode Island
- Metropolitan statistical area: Providence-Warwick, RI-MA
Providence Population Growth
- Population: 179,335 (Census Bureau – 2018 estimate)
- Population growth since 2017: 0.26% (Census Bureau – U.S. average is 0.62%)
- Population growth since 2010: 1.26% (Census Bureau – U.S. average is 5.96%)
- 5-year projected population growth: 0.2% (PwC/ULI – U.S. average is 0.7%)
Providence Rental Market
- Vacancy rate: 5.0% (Census Bureau – U.S. metropolitan average is 6.7%)
- Percentage of residents who rent their homes: 38.7% (Census Bureau – U.S. metropolitan average is 37.1%)
- Rent list price per square foot: $1.71 (Zillow – U.S. average is $1.14)
- Rental breakeven horizon: 1.6 years (Zillow – U.S. average is 2.0, meaning that buying is more financially advantageous than renting after 2 years)
- Rent to cost of ownership ratio: 0.7 (PwC/ULI – U.S. average is 0.8, meaning that the average rent payment in the area is 20% lower than a mortgage payment)
- Rent as % of household income: 23.5% (PwC/ULI – U.S. average is 33.4%, below 30% is considered ideal)
Providence Housing Market
- Median home value: $234,782 (Zillow – U.S. average is $243,225)
- Year-over-year home value growth: 4.6% (Zillow – U.S. average is 3.8%)
- 1-year projected home value growth: 5.1% (Zillow – U.S. average is 2.2%)
- Median list price per square foot: $198 (Zillow – U.S. average is $154)
- 5-year projected employment growth: 0.3% (PwC/ULI – U.S. average is 0.6%)
- Home affordability index: 127.2 (PwC/ULI – U.S. average is 153.0, meaning a resident making the median salary can afford to buy a median-priced home in the area 1.53 times over)
Providence Economy
- 5-year projected employment growth: 0.3% (PwC/ULI – U.S. average is 0.6%)
- Cost of living index: 94.1 (City Data – U.S. average is 100)
- Cost of doing business index: 105.5 (PwC/ULI – U.S. average is 100)
Take a deep dive into the New England real estate market to learn what’s going on in Providence and other cities within the region: Boston Rental Market Trends
Methodology
Here are all of the factors that we took into consideration for this year’s list of up-and-coming real estate markets, as well as the sources that the data was derived from.
Rental Market Health
- Rent growth over time – Zillow, Rentonomics, Zumper
- Projected rent growth – Zillow
- Rental vacancy rates over time – Census Bureau
- Projected cap rates for residential rentals – Mashvisor
- Multifamily unit absorption – Census Bureau
- Cost of renting vs. area median income – PwC/ULI, Zillow
- Rates of renting vs. homeownership – Census Bureau
- Cost of renting vs. homeownership – PwC/ULI
- Rental breakeven horizon – Zillow
Housing Market Health
- Home value growth over time – Zillow
- Projected home value growth – Zillow
- Sale price growth over time – PwC/ULI, Redfin
- Cost of buying a home vs. area median income – Zillow
- Market competitiveness – Redfin
- Homes with negative equity and delinquent mortgages – Zillow
Overall Real Estate Market Health
- Investor demand – PwC/ULI
- Projected opportunities for development and homebuilding – PwC/ULI
- Housing affordability – PwC/ULI
- Current housing prices, sales, and construction rates in comparison with previous cycle – PwC/ULI
Economic Health
- Unemployment rates over time – Bureau of Labor Statistics
- Job growth across sectors over time – CBRE, Bureau of Labor Statistics
- Projected job growth across sectors – PwC/ULI
- Projected GMP growth – PwC/ULI
- Projected income growth – PwC/ULI
- Cost of doing business – PwC/ULI
- Company funding over time – Startups USA
- Job market ratings – WalletHub
Other Factors
- Population growth over time – Census Bureau
- Projected population growth – PwC/ULI
- Cost of living – PwC/ULI, City Data
- Livability ratings – WalletHub (1 & 2)
- Crime rates – Neighborhood Scout
- Public transit availability – Redfin
- Median age – City Data
Please feel free to reach out to Robin Young ([email protected]) with any questions about this post.
Read more on Industry Research