

In 2019, the Buildium team is exploring the impact that major real estate trends are having on regions, states, and cities across the United States. This post will dig into the Great Lakes region-how the region compares to the rest of the country, and which demographic and economic trends are unfolding in six real estate markets that we’ve selected for in-depth coverage: Chicago, Detroit, Grand Rapids, Minneapolis, Madison, and Milwaukee.
Chart of Accounts
Want clearer, cleaner books? What about a more useful view into your properties or just easier accounting in general?
Get the GuideWe know that property management is inherently local. Each installment of our Local Markets blog series will combine data from our surveys of 3,746 property managers, rental owners, and residents across 340 metro areas with in-depth market research to give real estate professionals unique insight into what’s going on in their neck of the woods.
Click on your city to jump straight to insights for each market: Chicago, Detroit, Grand Rapids, Madison, Milwaukee, and Minneapolis.
2019 Rental Market Trends in the Great Lakes Region
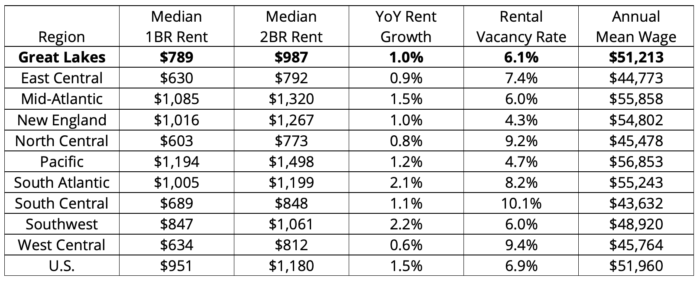
Rental Market Comparison: Great Lakes vs. Other Regions
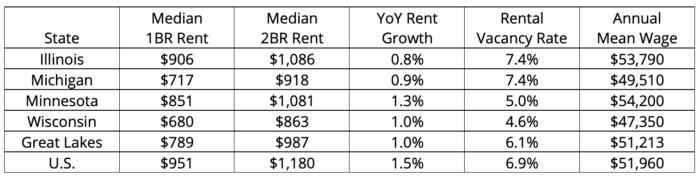
Rental Market Comparison: Great Lakes States
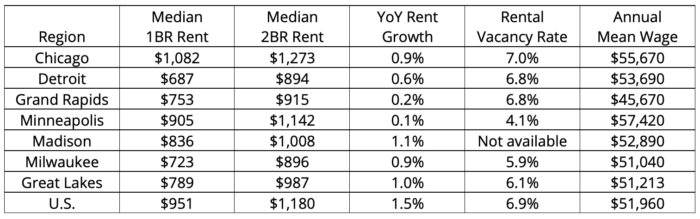
Rental Market Comparison: Great Lakes Cities
Chicago Rental Market Trends in 2019

Illinois is one of eight states whose population shrank between July 2017 and July 2018. The state experienced a net loss of 114,154 residents to other states in a single year. Not only that: This is the fifth year in a row that the state’s population has declined, and the rate of outmigration grows with each coming year.
Why are people fleeing Illinois in such great numbers? Among the 53% of Illinois voters who have reportedly considered leaving in the last year, a majority cite taxes as the primary reason, while others mention state government and politics. Illinois is in a vulnerable financial position: Poor spending decisions over the last two decades have resulted in enormous debt, which the state has tried to compensate for by continually raising taxes. However, the more unaffordable the cost of living in Illinois becomes, the more tax-payers leave for other states—worsening the shortfall year after year.
The Chicago metro area alone experienced a net loss of 22,068 residents between 2017 and 2018. The fastest rate of decline was visible among lower-income and black residents of Chicago’s South Side and the suburbs south of the city. At the same time, downtown Chicago experienced a boom in the construction of high-end apartment buildings, and employment growth for educated workers finally rebounded from the Great Recession. These factors are attracting higher-wage workers from the U.S. as well as other countries to the neighborhood—though not enough to stem the city’s population decline.
Chicago Rental Market Outlook for Property Managers & Rental Owners
What does all of this mean for property managers and rental owners in Chicago? Downtown rents and rental demand should remain strong as affluent renters continue to move in. However, in other areas of the city, low- and middle-income residents are feeling the pressure of stagnant wage growth relative to the cost of living. As this population continues its decline in Chicago, property managers will likely see softening occupancy rates and rent growth in non-downtown neighborhoods and suburbs.
Chicago Rental Market Statistics
Median rent for a 1-bedroom in Chicago: $1,082
- 19% higher than the median rent for the state ($906)
- 37% higher than the median rent for the region ($789)
- 14% higher than the median rent in the U.S. overall ($951)
Median rent for a 2-bedroom in Chicago: $1,273
- 17% higher than the median rent for the state ($1,086)
- 29% higher than the median rent for the region ($987)
- 8% higher than the median rent in the U.S. overall ($1,180)
Year-over-year rent growth in Chicago: 0.9%
- 13% higher than the state growth rate (0.8%)
- 10% lower than the regional growth rate (1.0%)
- 40% lower than the national growth rate (1.5%)
Rental vacancy rate in Chicago: 7.0%
- 5% lower than the state vacancy rate (7.4%)
- 15% higher than the regional vacancy rate (6.1%)
- 2% higher than the national vacancy rate (6.9%)
Rent to cost of homeownership ratio in Chicago: 0.7
- It’s 30% more affordable to rent than to buy a home in Chicago
- The rent to cost of homeownership ratio is 12% lower in Chicago than it is in the U.S. overall (0.8)
Rent as % of household income in Chicago: 23.9%
- A Chicago household making the median income spends 23.9% of their income on rent each month
- Rents are 18% more affordable for Chicago residents than they are for U.S. residents overall (29.1%)
Chicago Housing Market Statistics
Median home sales price in Chicago: $245,400
- 4% lower than the national median sales price ($254,800)
Year-over-year home sales price growth in Chicago: 1.4%
- 64% slower growth than the national rate (3.9%)
Home price to income ratio in Chicago: 150.8
- A household making the median income can purchase a home at the median price 1.5 times over in Chicago
- Homes are 1% less affordable for Chicago residents than they are for U.S. residents overall (151.7)
Chicago Economic Statistics
5-year projected population growth in Chicago: 0.2%
- 71% slower growth than the national rate (0.7%)
5-year projected employment growth in Chicago: 0.4%
- 33% slower growth than the national rate (0.6%)
Annual mean wage in Chicago: $55,670
- 3% higher than the mean wage for the state ($53,790)
- 9% higher than the mean wage for the region ($51,213)
- 7% higher than the national mean wage ($51,960)
Detroit Rental Market Trends in 2019

As Detroit recovers from financial collapse, the city is finally experiencing rising rents and decreasing vacancy rates. Though Detroit has gradually grown by 30,152 residents between 2010 and 2018, however, some warn that inequality is growing even faster—and that it may ultimately threaten the city’s recovery.
According to the Detroit MetroTimes, rents in the city rose more than 80% between July 2011 and February 2019. However, stagnant wage growth means that the average Detroit family is heavily cost-burdened, spending 46% of their household income on rent—a situation shared by nearly two-thirds of Detroit renters. In addition, many Detroit residents are still recovering from the housing market crash, with poor credit and steep rent costs preventing them from becoming homeowners again.
Multifamily construction has been strong in parts of Detroit, particularly in Downtown and Midtown—the seven-square-mile neighborhood at the forefront of the city’s revitalization story. High-end apartment buildings and major employers like Blue Cross Blue Shield Michigan and Quicken Loans are attracting young, educated workers to downtown Detroit—residents who can afford to pay rents twice the median rate for the city. To bring a broader spectrum of residents to the neighborhood, residential incentive programs like Live Downtown grant allowances of up to $2,500 for first year’s rent, and $1,000 for lease renewals; loans of up to $20,000 for first-time homeowners; or matched funds of up to $5,000 for exterior home improvements.
However, though the number of jobs per 100 residents has increased from 25 to 30 since 2010, a growing share of jobs located within the city limits are held by people who commute from the suburbs. In other words, the city’s job growth isn’t necessarily benefiting the city’s residents. As the Detroit Free Press notes, though African-Americans represent 80% of Detroit’s population, they hold just 33% of jobs within the city—a number that’s decreased over the last decade, as the city first descended into bankruptcy, then began the long climb back to financial health.
Detroit Rental Market Outlook for Property Managers & Rental Owners
What impact does this have on Detroit’s property managers and rental owners? Over the last decade, the city’s rental vacancy rates have fallen from 18.3 to 6.8%—a decrease of nearly two-thirds. In downtown neighborhoods and suburbs where job growth is strong, occupancy rates and rents should continue to rise. However, the city’s uneven economic recovery is making it tough for nearly 2 in 3 Detroiters to make ends meet. This may prevent any more dramatic increases in occupancy rates and rent prices in much of the city in the near future.
Detroit Rental Market Statistics
Median rent for a 1-bedroom in Detroit: $687
- 4% lower than the median rent for the state ($717)
- 13% lower than the median rent for the region ($789)
- 28% lower than the median rent in the U.S. overall ($951)
Median rent for a 2-bedroom in Detroit: $894
- 3% lower than the median rent for the state ($918)
- 9% lower than the median rent for the region ($987)
- 24% lower than the median rent in the U.S. overall ($1,180)
Year-over-year rent growth in Detroit: 0.6%
- 33% lower than the state growth rate (0.9%)
- 40% lower than the regional growth rate (1.0%)
- 60% lower than the national growth rate (1.5%)
Rental vacancy rate in Detroit: 6.8%
- 8% lower than the state vacancy rate (7.4%)
- 12% higher than the regional vacancy rate (6.1%)
- 1% lower than the national vacancy rate (6.9%)
Rent to cost of homeownership ratio in Detroit: 0.8
- It’s 20% more affordable to rent than to buy a home in Detroit
- The rent to cost of homeownership ratio is the same in Detroit as it is in the U.S. overall (0.8)
Rent as % of household income in Detroit: 20.1%
- A Detroit household making the median income spends 20.1% of their income on rent each month (below 30% is considered ideal)
- Rents are 31% more affordable for Detroit residents than they are for U.S. residents overall (29.1%)
Detroit Housing Market Statistics
Home price to income ratio in Detroit: 201.4
- A household making the median income can purchase a home at the median price 2 times over in Detroit
- Homes are 33% more affordable for Detroit residents than they are for U.S. residents overall (151.7)
Detroit Economic Statistics
5-year projected population growth in Detroit: 0%
- 100% slower growth than the national rate (0.7%)
5-year projected employment growth in Detroit: 0%
- 100% slower growth than the national rate (0.6%)
Annual mean wage in Detroit: $53,690
- 8% higher than the mean wage for the state ($49,510)
- 5% higher than the mean wage for the region ($51,213)
- 3% higher than the national mean wage ($51,960)
Grand Rapids Rental Market Trends in 2019

It’s been a banner year for housing price growth in Grand Rapids. Though it’s still significantly more affordable to live in the Grand Rapids metro area than much of the country, home values have increased by 11.6% in the last year, and are expected to grow an additional 5.8% in the coming year. Home sales prices in Grand Rapids are forecast to grow by 8.2% throughout 2019.
What’s driving this rapid growth in Grand Rapids’ housing and rental markets? Conditions are largely the same as in other hot markets across the country: Millennials are searching for starter homes and affordable rentals at the same time as many Baby Boomers are looking to downsize. Higher interest rates and steep competition for new homes are motivating current homeowners to stay put, reducing the number of existing homes on the market. In addition, construction of new homes is expensive and isn’t happening quickly enough to match homebuyers’ interest, resulting in slowing home sales in 2019.
Residents are concerned that steep price growth and competition are the new normal in Grand Rapids—especially as wage growth fails to keep up with inflation in Michigan. Overall, the Grand Rapids job market is thriving: In 2009, when the Great Recession added insult to injury after the state had shed nearly a million manufacturing jobs, unemployment in Michigan reached 15.4%, but has since fallen to 4.8%. Grand Rapids alone has gained more than 100,000 jobs since 2009, after losing 52,000 jobs in the ten years prior. However, in the same time period, wages have grown by a paltry 2.5%; and in 2018, Grand Rapids residents earned 12% less than the average American.
These numbers matter less to residents who are flocking to Grand Rapids from out of state. U-Haul’s annual analysis of migration trends found that Grand Rapids was the fifth most popular destination among U.S. movers last year. In addition, the National Association of Realtors named Grand Rapids one of ten cities that Millennials are flocking to in 2019, with Millennials representing a staggering 73% of new residents.
Grand Rapids Rental Market Outlook for Property Managers & Rental Owners
Overall, it’s a good time to own investment property in Grand Rapids: With competition in the housing market heating up at an unprecedented pace over the last year, rents will rise at a faster pace in 2019 than in years past—though they’ll likely remain more affordable than buying for now. As young workers flock to Grand Rapids for its affordability and strong job market, and current residents are priced out of the housing market, rental demand will undoubtedly increase throughout the coming year.
Grand Rapids Rental Market Statistics
Median rent for a 1-bedroom in Grand Rapids: $753
- 5% higher than the median rent for the state ($717)
- 4% lower than the median rent for the region ($789)
- 21% lower than the median rent in the U.S. overall ($951)
Median rent for a 2-bedroom in Grand Rapids: $915
- 0% higher than the median rent for the state ($918)
- 7% lower than the median rent for the region ($987)
- 22% lower than the median rent in the U.S. overall ($1,180)
Year-over-year rent growth in Grand Rapids: 0.2%
- 78% lower than the state growth rate (0.9%)
- 80% lower than the regional growth rate (1.0%)
- 87% lower than the national growth rate (1.5%)
Rental vacancy rate in Grand Rapids: 6.8%
- 8% lower than the state vacancy rate (7.4%)
- 12% higher than the regional vacancy rate (6.1%)
- 1% lower than the national vacancy rate (6.9%)
Grand Rapids Housing Market Statistics
Median home sales price in Grand Rapids: $192,000
- 25% lower than the national median sales price ($254,800)
Year-over-year home sales price growth in Grand Rapids: 6.8%
- 74% faster growth than the national rate (3.9%)
Grand Rapids Economic Statistics
Annual mean wage in Grand Rapids: $45,670
- 8% lower than the mean wage for the state ($49,510)
- 11% lower than the mean wage for the region ($51,213)
- 12% lower than the national mean wage ($51,960)
Madison Rental Market Trends in 2019

Madison is a city that some believe is on the verge of exploding in popularity. It consistently ranks among the Best Places to Live in the country on lists such as those compiled by TIME, U.S. News, and Livability; and was also identified by the National Association of Realtors as the #1 destination for Millennial movers in 2019.
What makes Madison such an appealing place to live? In comparison with other cities, it’s affordable: A two-bedroom apartment in Madison rents for 14% less than in the U.S. overall; 20% less than in Chicago, the closest large city; and a staggering 60% less than in New York City.
In addition, there’s a strong job market, with Madison’s growing reputation as a tech hub attracting new employees and businesses to the city. Unemployment rates have steadily been between 1 and 3.5 points lower in Madison than the country as a whole, even at the height of the Great Recession. A diversified economy softened the blow of the recession in Madison in comparison with other cities, with the city’s largest employers spread across technology, healthcare, life sciences, manufacturing, agriculture, and the public sector. The metro’s largest employers include ZenDesk, Epic Systems, American Family Insurance, American Girl Brands, and the University of Wisconsin.
How quickly is Madison growing? Between 2010 and 2018, the Madison metro area’s population grew by 9.1%, to a total of 660,000 residents; while the city itself grew to 260,000 residents, an increase of 10.8%. The city plans to add an additional 18,000 residents by 2023.
But Madison’s rising popularity presents it with an issue familiar to other thriving U.S. cities: They can’t build housing fast enough to accommodate new and existing residents. Between 2010 and 2018, 4,120 residential units were approved for construction in downtown Madison; and since 2011, the number of downtown rental units has increased by 36%. However, astonishingly low vacancy rates—as low as 2.56% in 2013—make it clear how quickly new units are absorbed by Madison residents searching for places to live downtown.
Rents in Madison are lower than in much of the U.S.: On average, one-bedroom apartments rent for 12% less than the national median, and two-bedrooms rent for 14% less. However, as the demand for rentals outpaces the supply, Madison residents’ wages don’t give them much wiggle room to accommodate rising rents. Many of the city’s newly-built units are in upscale buildings downtown, geared toward tech workers and out-of-state movers whose salaries go farther in Madison than in other places. However, this leaves lower-wage workers struggling to find affordable rentals convenient to their places of employment.
Madison Rental Market Outlook for Property Managers & Rental Owners
Property managers and owners in Madison will continue to enjoy low vacancy rates and home prices throughout 2019, particularly in non-luxury rentals. Though rents are lower than in much of the country, they’re higher in Madison than in both Wisconsin and the Great Lakes region overall. As word spreads of the city’s appeal, a steady influx of young workers will keep rent growth strong in the coming years, making it a great time to invest in Madison rental properties.
Madison Rental Market Statistics
Median rent for a 1-bedroom in Madison: $836
- 23% higher than the median rent for the state ($680)
- 6% higher than the median rent for the region ($789)
- 12% lower than the median rent in the U.S. overall ($951)
Median rent for a 2-bedroom in Madison: $1,008
- 17% higher than the median rent for the state ($863)
- 2% higher than the median rent for the region ($987)
- 14% lower than the median rent in the U.S. overall ($1,180)
Year-over-year rent growth in Madison: 1.1%
- 10% higher than the state growth rate (1.0%)
- 10% higher than the regional growth rate (1.0%)
- 27% lower than the national growth rate (1.5%)
Rent to cost of homeownership ratio in Madison: 0.4
- It’s 60% more affordable to rent than to buy a home in Madison
- The rent to cost of homeownership ratio is 50% lower in Madison than it is in the U.S. overall (0.8)
Rent as % of household income in Madison: 13.0%
- A Madison household making the median income spends 13% of their income on rent each month (below 30% is considered ideal)
- Rents are 55% more affordable for Madison residents than they are for U.S. residents overall (29.1%)
Madison Housing Market Statistics
Median home sales price in Madison: $285,100
- 12% higher than the national median sales price ($254,800)
Year-over-year home sales price growth in Madison: 4.5%
- 15% faster growth than the national rate (3.9%)
Home price to income ratio in Madison: 161.5
- A household making the median income can purchase a home at the median price 1.6 times over in Madison
- Homes are 7% more affordable for Madison residents than they are for U.S. residents overall (151.7)
Madison Economic Statistics
5-year projected population growth in Madison: 0.8%
- 14% faster growth than the national rate (0.7%)
5-year projected employment growth in Madison: 0.9%
- 50% faster growth than the national rate (0.6%)
Annual mean wage in Madison: $52,890
- 12% higher than the mean wage for the state ($47,350)
- 3% higher than the mean wage for the region ($51,213)
- 2% higher than the national mean wage ($51,960)
Milwaukee Rental Market Trends in 2019

Though Milwaukee and Madison are just 80 miles apart, the cities’ growth patterns tell two very different stories. Between 2010 and 2018, the Milwaukee metro grew by just 1.3%, while Madison grew by 9.1%. Milwaukee—a city of nearly 1.6 million residents—experienced a net increase of just 962 residents between 2017 and 2018, while Madison—with just 660,000 residents—had a net gain of 5,845. Wisconsin is growing for the first time in years, but it’s Madison that has played the starring role.
What makes Milwaukee different from Madison? Some believe that Madison’s success is due to its growing reputation as a tech hub, attracting young workers to the city’s strong job market. In contrast, Milwaukee’s lack of growth is similar to other Rust Belt cities: In years that Milwaukee’s population shrank, Chicago, Detroit, Cleveland, and similar cities also saw declines. Some studies show that in particular, it’s college graduates and Millennials who are leaving Milwaukee for the job opportunities and quality of life that cities like Madison can provide.
Milwaukee is making efforts to increase its appeal to young professionals; the most visible updates have been the addition of streetcar service, a RiverWalk, and apartment buildings downtown. But Milwaukee County is losing its working-age population—a problem it shares with 97% of Wisconsin’s counties. (Which county isn’t losing workers? Dane County—home to Madison.) Across the state, while the number of working-age residents is growing at a rate of 0.2%, jobs are growing at a rate of 6%. Half an hour south of Milwaukee, in Mount Pleasant, it’s unclear where the controversial, still-in-flux Foxconn plant will pull workers from.
For those who do call Milwaukee home, many find that insufficient transit systems limit their access to job opportunities. The vast majority of job growth in recent years has occurred in the suburbs, limiting city dwellers’ access to employment opportunities—particularly in majority-minority neighborhoods like Milwaukee’s North Side. Federal funding for a high-speed rail connection between Milwaukee and Madison was turned down by the state’s transit-averse governor in 2011. Between 2001 and 2011, service cuts to Milwaukee’s bus system cut off access to as many as 42,000 jobs across 1,324 employers no longer reachable from downtown by public transit. The city’s new streetcar brought access to downtown neighborhoods that are largely frequented by tourists, rather than areas where workers live.
Some experts predict that we’ll see building pick up in suburbs adjacent to Milwaukee, where major employers like Kohl’s, S.C. Johnson, GE Healthcare, and Johnson Controls attract workers. In Milwaukee’s suburbs, a shortage of starter homes on the market is resulting in higher prices on houses that do sell; so renting may remain an attractive option for segments of the population.
Milwaukee Rental Market Outlook for Property Managers & Rental Owners
Property managers and owners in the Milwaukee metro area may want to look to suburbs with access to major employers, such as Menomonee Falls and Waukesha, for rising occupancy rates and rents. Meanwhile, in the downtown Milwaukee rental market, a rising supply of new apartments has begun to outpace renter demand—particularly without a steady influx of residents moving to the city. 5,500 new units flooded downtown Milwaukee throughout 2017 and 2018, resulting in elevated vacancy rates; though completions are expected to slow in 2019 and beyond. Property managers should keep a close watch on how rents and vacancy rates evolve as these units are absorbed in downtown neighborhoods.
Milwaukee Rental Market Statistics
Median rent for a 1-bedroom in Milwaukee: $723
- 6% higher than the median rent for the state ($680)
- 8% lower than the median rent for the region ($789)
- 24% lower than the median rent in the U.S. overall ($951)
Median rent for a 2-bedroom in Milwaukee: $896
- 4% higher than the median rent for the state ($863)
- 9% lower than the median rent for the region ($987)
- 24% lower than the median rent in the U.S. overall ($1,180)
Year-over-year rent growth in Milwaukee: 0.9%
- 10% lower than the state growth rate (1.0%)
- 10% lower than the regional growth rate (1.0%)
- 40% lower than the national growth rate (1.5%)
Rental vacancy rate in Milwaukee: 5.9%
- 28% higher than the state vacancy rate (4.6%)
- 3% lower than the regional vacancy rate (6.1%)
- 14% lower than the national vacancy rate (6.9%)
Rent to cost of homeownership ratio in Milwaukee: 0.6
- It’s 40% more affordable to rent than to buy a home in Milwaukee
- The rent to cost of homeownership ratio is 25% lower in Milwaukee than it is in the U.S. overall (0.8)
Rent as % of household income in Milwaukee: 20.8%
- A Milwaukee household making the median income spends 20.8% of their income on rent each month (below 30% is considered ideal)
- Rents are 28% more affordable for Milwaukee residents than they are for U.S. residents overall (29.1%)
Milwaukee Housing Market Statistics
Median home sales price in Milwaukee: $239,600
- 6% lower than the national median sales price ($254,800)
Year-over-year home sales price growth in Milwaukee: 5.9%
- 51% faster growth than the national rate (3.9%)
Home price to income ratio in Milwaukee: 153.1
- A household making the median income can purchase a home at the median price 1.5 times over in Milwaukee
- Homes are 1% more affordable for Milwaukee residents than they are for U.S. residents overall (151.7)
Milwaukee Economic Statistics
5-year projected population growth in Milwaukee: 0.1%
- 86% slower growth than the national rate (0.7%)
5-year projected employment growth in Milwaukee: 0.2%
- 67% slower growth than the national rate (0.6%)
Annual mean wage in Milwaukee: $51,040
- 8% higher than the mean wage for the state ($47,350)
- 0% higher than the mean wage for the region ($51,213)
- 2% lower than the national mean wage ($51,960)
Minneapolis Rental Market Trends in 2019

In Minneapolis, as in housing markets across the U.S., a shortage of affordable homes for sale is putting upward pressure on prices. The numbers are striking in comparison with years past: The number of homes actively listed on the market in Minneapolis fell by 75% between 2007 and 2017, with the inventory of homes shrinking from a 7-month supply to 1.4 months in the same time period. (For reference, a 6-month supply is considered healthy.) Over the course of 2018, the median home sales price in Minneapolis increased by 8% to an all-time high of $265,000. Property managers report that the demand for homes is motivating many Minneapolis owners to sell.
At the same time, another national trend is playing out in the Twin Cities: Affluent renters, and other demographics who we’d normally expect to be making the transition to homeownership in a thriving economy, are instead choosing to rent. Between steep competition for starter homes, the increasing appeal of amenity-rich downtown communities, and an influx of young workers to the the Twin Cities, renters now represent a majority of Minneapolis households.
Luckily, in 2018, construction brought more new apartments to the Twin Cities than the metro had seen in over a decade—though 82% of units that came online were leased within the year. Over 4,800 units were completed in the city last year, of which more than a quarter were located in downtown Minneapolis; and an additional 3,100 to 3,600 are expected to come online before the end of 2020. Last December, Minneapolis banned single-family zoning, opening the door for multi-family residences and increased housing capacity throughout the city’s neighborhoods. And a new light-rail train line was unveiled in 2017, helping to connect St. Paul residents to new job opportunities in downtown Minneapolis.
Why is there such strong demand for housing in Minneapolis? Between 2010 and 2018, the number of people living in the Twin Cities metro area grew by 9.3%, while housing units only increased by 6.4%. The population of downtown Minneapolis grew by 12.2%, while St. Paul increased by 9.8%. Residents are attracted to the metro’s strong economy, buoyed by Fortune 500 companies like Target, Best Buy, 3M, and General Mills; as well as the affordable cost of living in comparison with coastal markets. On average, Minneapolis residents earn 11% more per year than other American workers.
Minneapolis Rental Market Outlook for Property Managers & Rental Owners
Overall, the Twin Cities are one of the country’s most desirable markets for investors in 2019 and beyond. Though vacancy rates have risen slightly in neighborhoods experiencing a flurry of construction, demand from renters has kept occupancy and rent growth rates strong.
Minneapolis Rental Market Statistics
Median rent for a 1-bedroom in Minneapolis: $905
- 6% higher than the median rent for the state ($851)
- 15% higher than the median rent for the region ($789)
- 5% lower than the median rent in the U.S. overall ($951)
Median rent for a 2-bedroom in Minneapolis: $1142
- 6% higher than the median rent for the state ($1,081)
- 16% higher than the median rent for the region ($987)
- 3% lower than the median rent in the U.S. overall ($1,180)
Year-over-year rent growth in Minneapolis: 0.1%
- 92% lower than the state growth rate (1.3%)
- 90% lower than the regional growth rate (1.0%)
- 93% lower than the national growth rate (1.5%)
Rental vacancy rate in Minneapolis: 4.1%
- 18% lower than the state vacancy rate (5.0%)
- 33% lower than the regional vacancy rate (6.1%)
- 41% lower than the national vacancy rate (6.9%)
Rent to cost of homeownership ratio in Minneapolis: 0.7
- It’s 30% more affordable to rent than to buy a home in Minneapolis
- The rent to cost of homeownership ratio is 12% lower in Minneapolis than it is in the U.S. overall (0.8)
Rent as % of household income in Minneapolis: 20.5%
- A Minneapolis household making the median income spends 20.5% of their income on rent each month (below 30% is considered ideal)
- Rents are 30% more affordable for Minneapolis residents than they are for U.S. residents overall (29.1%)
Minneapolis Housing Market Statistics
Median home sales price in Minneapolis: $275,500
- 8% higher than the national median sales price ($254,800)
Year-over-year home sales price growth in Minneapolis: 5.8%
- 49% faster growth than the national rate (3.9%)
Home price to income ratio in Minneapolis: 167.4
- A household making the median income can purchase a home at the median price 1.7 times over in Minneapolis
- Homes are 10% more affordable for Minneapolis residents than they are for U.S. residents overall (151.7)
Minneapolis Economic Statistics
5-year projected population growth in Minneapolis: 0.8%
- 14% faster growth than the national rate (0.7%)
5-year projected employment growth in Minneapolis: 0.7%
- 17% faster growth than the national rate (0.6%)
Annual mean wage in Minneapolis: $57,420
- 6% higher than the mean wage for the state ($54,200)
- 12% higher than the mean wage for the region ($51,213)
- 11% higher than the national mean wage ($51,960)
Rental Trends in the Great Lakes Region

Why Residents Move to the Great Lakes Region
In our survey of U.S. renters, a typical resident of the Great Lakes region moved to their current metro area in 2015, and has moved approximately twice in the last five years. The most common reasons why they moved to their current city were to be close to the people they care about (27%), to attend school (23%), or for career opportunities (22%).
In Their Own Words: Why Renters Moved to Their Current Metro in the Great Lakes
- “I moved here because my wife is attending school. I’m staying because of jobs and affordability.” (Rochester, MN)
- “Education for my kids. [This area has] some of the best schools in the country.” (Chicago, IL)
- “My company relocated me here. I grew up in this area, so I was happy to come back.” (Chicago, IL)
Where Renters Live in the Great Lakes Region
In the Great Lakes region, it’s most common for renters to live in single-family homes (38%), multi-family homes (21%), and small apartment buildings (17%). 53% of renters live in the suburbs, 31% live downtown, and 16% live in rural areas.
In Their Own Words: How Great Lakes Residents Want Their Rental to Make Them Feel
We asked renters to complete the sentence: “I want my rental to make me feel…”
- “Like I’m in a home of my own. I don’t want to feel like it’s transient—something I’m just ‘living with’ until I buy something.”
- “Like I’m part of a larger community. Safe. Comfortable. Not tied down.”
- “Like I belong here. I want to come home and just feel welcomed and relaxed. I want my rental to be a stress-free zone.”
- “Safe, secure, and able to develop a financially secure future.”
Attracting & Retaining Renters in the Great Lakes Region

In our survey of U.S. renters, 41% of Great Lakes renters plan on renewing their lease for another year; 28% plan on moving; and 31% are on the fence about whether to stay or go. 45% would prefer owning their home to renting, but they feel that they’re not in a position to buy right now. Just 17% of Great Lakes renters plan on buying their own home in the near future—likely due to the affordable cost of renting.
Most-Wanted Amenities Among Renters in the Great Lakes Region
More than half of Great Lakes renters say that these neighborhood qualities would influence their choice of one rental over another:
- A safe neighborhood – selected by 70% of respondents
- Proximity to work, school, or transportation – 62%
- Proximity to stores and restaurants – 52%
1 in 2 Great Lakes renters say that these building amenities would impact their choice of one rental over another:
- A laundry room – 53%
- Garbage pick-up – 53%
- High-speed internet – 51%
Over 50% of Great Lakes renters say that these unit amenities would affect their choice of one rental over another:
- An in-unit washer and dryer – 63%
- Central air conditioning – 60%
- A dishwasher – 54%
- Being allowed to have a pet – 53%
- A balcony, porch, or private patio – 53%