

In our Local Markets blog series, the Buildium Team is exploring the impact that major real estate trends are having on cities, states, and regions of the United States. Each post combines data from our surveys of 3,746 property managers, rental owners, and residents across 340 metro areas with comprehensive market research to give real estate professionals invaluable insight into what’s going on in their neck of the woods. This post will dig into the South Central U.S.—how the region compares to the rest of the country, and which demographic and economic trends are unfolding in six real estate markets that we’ve selected for in-depth coverage. Click on your city to jump straight to insights for each market: Austin, Dallas, Houston, Nashville, New Orleans, and San Antonio.
Chart of Accounts
Want clearer, cleaner books? What about a more useful view into your properties or just easier accounting in general?
Get the Guide2019 Rental Market Trends in the South Central U.S.
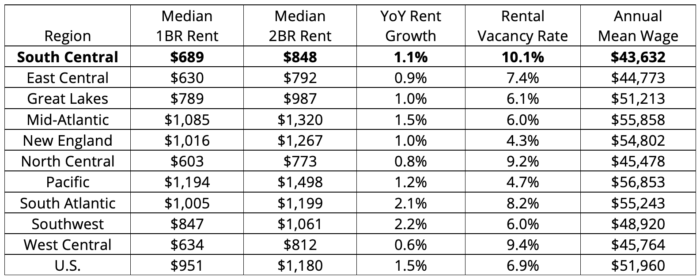
Rental Market Comparison: South Central U.S. vs. Other Regions
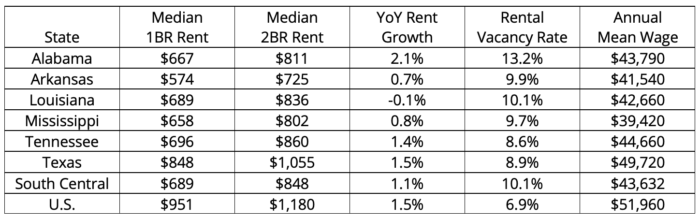
Rental Market Comparison: South Central States
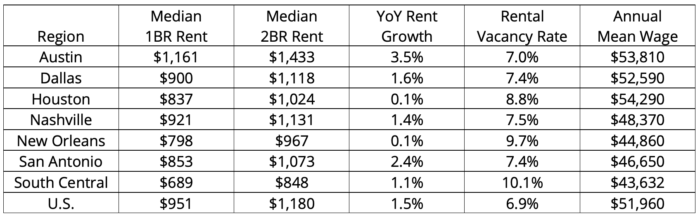
Rental Market Comparison: South Central Cities
Austin Rental Market Trends in 2019

By all measures, Austin is on the rise—and it has been for some time. From rents to home prices, jobs to population growth, the city is flourishing.
Austin’s population has grown faster than all other major U.S. metros for the last 8 years in a row—26.3% growth since 2010—and 42 states have experienced a net loss of residents moving to the Austin metro. On average, 145 new residents arrived in Austin each day between July 2017 and July 2018. Many new residents are coming from overheated coastal markets like the Bay Area, Los Angeles, Seattle, and New York; or from other cities in Texas, like Houston and Dallas, according to Redfin’s latest migration report.
In any thriving city, though, rapid growth has its pros and cons. In the past, the cost of living in emerging tech hubs like Austin was temptingly low—especially in comparison with established markets like Silicon Valley. At the same time, job growth in Austin has been strong, reaching a rate of 3.7% in 2018—partially fueled by the decision of tech giants like Apple, Google, Amazon, and Facebook to expand their presence in Austin. Austin now has the fifth-highest share of tech jobs in the U.S., with 60,000 new IT positions added between 2014 and 2017.
But as Austin’s thriving economy attracts higher-salary workers, the cost of living is increasing sharply—making it tough for lower-income residents to benefit from the city’s success. A Forbes study found that in order to live comfortably in Austin in 2018, a resident needs to make $73,163 per year—an increase of 34% over the previous year. The number of affluent renters living in Austin has increased by 142% in the last decade, compared with 48% growth in this segment on a national level. In 2018, a minimum wage worker would have needed to work 109 hours a week to afford the average one-bedroom apartment.
Steep rent growth is one factor that’s driving the increasing cost of living in Austin. Over the last year, rents have risen 218% faster in Austin than the rest of the South Central region, and rent prices are 69% higher. The supply of new units outpaced demand from renters in 2016 and 2017, temporarily slowing growth in rents and occupancy rates. But in 2018, fueled by strong job growth and a steady influx of new residents, 11,313 new units were leased—a new record, and a 192% increase over the previous year. 12,500 more units are expected to hit the market in 2019 and are expected to be absorbed almost as quickly as they were last year due to strong market conditions. Overall, Austin has the second-highest rate of apartment growth in the U.S., with the city’s inventory increasing by 29% between 2010 and 2018.
Austin Rental Market Outlook for Property Managers & Rental Owners
It’s a great time to be a property manager or owner in Austin. Though the escalating cost of living will push some people away, residents of overheated markets will continue to find Austin an appealing place to live: Over the next 5 years, the metro’s population is predicted to grow 229% faster than the rest of the country. If Austin’s job market expands at its expected rate—223% faster growth than the U.S. overall in the next 5 years— strong demand from renters should keep rents and occupancy rates growing at a healthy rate.
Austin Rental Market Statistics
Median rent for a 1-bedroom in Austin: $1,161
- 37% higher than the median rent for the state ($848)
- 69% higher than the median rent for the region ($689)
- 22% higher than the median rent in the U.S. overall ($951)
Median rent for a 2-bedroom in Austin: $1,433
- 36% higher than the median rent for the state ($1,055)
- 69% higher than the median rent for the region ($848)
- 21% higher than the median rent in the U.S. overall ($1,180)
Year-over-year rent growth in Austin: 3.5%
- 133% higher than the state growth rate (1.5%)
- 218% higher than the regional growth rate (1.1%)
- 133% higher than the national growth rate (1.5%)
Rental vacancy rate in Austin: 7.0%
- 21% lower than the state vacancy rate (8.9%)
- 31% lower than the regional vacancy rate (10.1%)
- 2% higher than the national vacancy rate (6.9%)
Rent to cost of homeownership ratio in Austin: 0.6
- It’s 40% more affordable to rent than to buy a home in Austin
- The rent to cost of homeownership ratio is 25% lower in Austin than in the U.S. overall (0.8)
Rent as % of household income in Austin: 19.4%
- An Austin household making the median income spends 19.4% of their income on rent each month (below 30% is considered ideal)
- Rents are 33% more affordable for Austin residents than they are for U.S. residents overall (29.1%)
Austin Housing Market Statistics
Median home sales price in Austin: $303,400
- 19% higher than the national median sales price ($254,800)
Year-over-year home sales price growth in Austin: 2.4%
- 38% slower growth than the national rate (3.9%)
Home price to income ratio in Austin: 142.4
- A household making the median income can purchase a home at the median price 1.4 times over in Austin
- Homes are 6% less affordable for Austin residents than they are for U.S. residents overall (151.7)
Austin Economic Statistics
5-year projected population growth in Austin: 2.3%
- 229% faster growth than the national rate (0.7%)
5-year projected employment growth in Austin: 2.0%
- 233% faster growth than the national rate (0.6%)
Annual mean wage in Austin: $53,810
- 8% higher than the mean wage for the state ($49,720)
- 23% higher than the mean wage for the region ($43,632)
- 4% higher than the national mean wage ($51,960)
Dallas Rental Market Trends in 2019

Between 2010 and 2018, the Dallas-Fort Worth-Arlington metro area gained well over a million residents, growing at a rate of 17.3% as the U.S. grew by just 6%. An average of 246 new residents arrived in the Dallas metro each day between July 2017 and July 2018—the fastest increase in the country. In the years to come, the Metroplex is projected to grow 143% more quickly than the rest of the country.
Dallas is the fourth-largest city in the country, but it may rise up the ranks in the future: The only three cities larger than Dallas (New York City, Los Angeles, and Chicago) are all losing residents. Funny enough, these three metros are losing residents to Dallas: 15% of Redfin users looking to relocate to Dallas come from Los Angeles, and 6% are from Chicago and New York City. An additional 9% hail from the Bay Area—another metro whose cost of living is far higher than residents can afford, motivating some to search for a more affordable place to call home.
Dallas’ rate of multifamily construction has also been outsized, with more market-rate apartments being delivered in the metro since 2010 than anywhere else in the country: 139,600 newly-built units, with an additional 30,000 expected by 2020. New construction isn’t just happening downtown: Though Intown Dallas leads the metro in supply, suburbs like Frisco and Allen/McKinney have received nearly as many new units, as has downtown Fort Worth.
Though the increase in supply is slowing rent growth in downtown Dallas, rents are rising faster than ever in the Mid-Cities submarkets between Dallas and Fort Worth. Since 2010, slower-growth neighborhoods like North Arlington, East Fort Worth, and Far North Dallas have seen rents increase by 45%, 44%, and 43%, respectively. In comparison, Intown Dallas rents grew by just 28% after apartment inventory in the neighborhood increased by 63% over the last 8 years.
One reason for Dallas’ steady growth over the years has been its strong job market. The city of Dallas added 717,000 jobs between 2010 and 2017; and in 2018, the Metroplex as a whole gained more than 100,000 additional jobs—second only to New York City’s 141,000 new jobs. 24 Fortune 500 companies are located in the Dallas-Fort Worth metro area, including Exxon Mobil, McKesson, AT&T, American Airlines Group, and Kimberly-Clark; and 75 companies have chosen to relocate their headquarters to DFW in recent years.
Dallas Rental Market Outlook for Property Managers & Rental Owners
Overall, strong population growth and the affordability of renting in comparison with owning a home make it a smart time to get in on the Dallas-Fort Worth rental market. PwC and ULI’s most recent Emerging Trends in Real Estate report named DFW the top market to watch for overall real estate prospects in 2019. The best potential for rent growth may not be in downtown Dallas, however—property managers and owners may want to look to Fort Worth, the Dallas suburbs, and the Mid-Cities submarkets between the two cities for larger rent increases in 2019 and beyond.
Dallas Rental Market Statistics
Median rent for a 1-bedroom in Dallas: $900
- 6% higher than the median rent for the state ($848)
- 31% higher than the median rent for the region ($689)
- 5% lower than the median rent in the U.S. overall ($951)
Median rent for a 2-bedroom in Dallas: $1,118
- 6% higher than the median rent for the state ($1,055)
- 32% higher than the median rent for the region ($848)
- 5% lower than the median rent in the U.S. overall ($1,180)
Year-over-year rent growth in Dallas: 1.6%
- 7% higher than the state growth rate (1.5%)
- 46% higher than the regional growth rate (1.1%)
- 7% higher than the national growth rate (1.5%)
Rental vacancy rate in Dallas: 7.4%
- 17% lower than the state vacancy rate (8.9%)
- 27% lower than the regional vacancy rate (10.1%)
- 7% higher than the national vacancy rate (6.9%)
Rent to cost of homeownership ratio in Dallas: 0.6
- It’s 40% more affordable to rent than to buy a home in Dallas
- The rent to cost of homeownership ratio is 25% lower than in the U.S. overall (0.8)
Rent as % of household income in Dallas: 21.2%
- A Dallas household making the median income spends 21.2% of their income on rent each month (below 30% is considered ideal)
- Rents are 27% more affordable for Dallas residents than they are for U.S. residents overall (29.1%)
Dallas Housing Market Statistics
Median home sales price in Dallas: $254,300
- 0.2% lower than the national median sales price ($254,800)
Year-over-year home sales price growth in Dallas: 1.4%
- 64% slower growth than the national rate (3.9%)
Home price to income ratio in Dallas: 145.4
- A household making the median income can purchase a home at the median price 1.5 times over in Dallas
- Homes are 4% less affordable for Dallas residents than they are for U.S. residents overall (151.7)
Dallas Economic Statistics
5-year projected population growth in Dallas: 1.7%
- 143% faster growth than the national rate (0.7%)
5-year projected employment growth in Dallas: 1.4%
- 133% faster growth than the national rate (0.6%)
Annual mean wage in Dallas: $52,590
- 6% higher than the mean wage for the state ($49,720)
- 21% higher than the mean wage for the region ($43,632)
- 1% higher than the national mean wage ($51,960)
Houston Rental Market Trends in 2019

Though it shares a state with Austin and Dallas, the city of Houston is in an entirely different position from these cities. Known as the Energy Capital of the World, Houston’s economy has tended to wax and wane along with the price of oil. When oil prices dropped by 75% in the mid-2010s, 1 in 4 energy-related jobs disappeared—two-thirds of which never returned, even once prices rebounded.
When oil prices were at their peak, developers had financed the construction of 60,000 apartments in downtown Houston—but by the time these units came online, the oil industry had bottomed out. This left the city with a glut of apartments, increasing with each coming year, without enough high-earning workers to fill them.
Fortunately, in the years since the previous oil bust of the ’80s, Houston’s economy had diversified. Jobs lost in the energy sector were balanced by jobs created in other areas, resulting in smaller-than-expected job loss numbers of 2,500 in 2015 and 2,200 in 2016, shooting back up to gains of 62,900 jobs in 2017 and 85,400 in 2018.
In 2019, the City of Houston believes that the greatest job growth will occur in healthcare and construction—not energy. But because so many jobs in Houston depend on the oil industry—beyond energy workers themselves, there’s also the retail, service, and healthcare workers who earn a paycheck by serving others—the city’s economy still mirrors the peaks and valleys of oil prices in Texas.
In addition to the oil industry’s downturn, the city faced another blow in recent years: Hurricane Harvey. The storm made landfall in Houston in August 2017. Up to 30% of the county was underwater, causing damage to an estimated 204,000 homes and 42,000 apartments, and shutting down 25% of the area’s oil and gas production.
This catastrophic storm had an unexpected effect on the rental market, however: The city’s declining rents and occupancy rates took a turn for the better after displaced Houston homeowners, as well as incoming insurance adjusters and relief workers, increased the demand for rentals. In the months following Hurricane Harvey, Houston-area rents rose to their highest rate in years, and 17,000 units were absorbed in just two months. While these gains have since moderated, and rents are currently growing at a pace that’s well below the national average, they did help Houston’s rental market to reset after a difficult few years.
Houston Rental Market Outlook for Property Managers & Rental Owners
In spite of the struggles it’s endured, the Houston metro area’s population has experienced net growth of 18.2% over the last 8 years. 91,689 new residents arrived in the Houston area between July 2017 and July 2018. Redfin’s latest migration report shows a significant portion of users interested in relocating to Houston coming from markets like Los Angeles, the Bay Area, Washington D.C., and Chicago—part of the trend of residents from overheated markets moving to more affordable cities in the South and West. Though Houston won’t see the kind of rent growth that Austin and Dallas are currently experiencing in 2019, we expect that population growth, a strong job market, and slower rates of construction will keep Houston’s rental market healthy in the near future.
Houston Rental Market Statistics
Median rent for a 1-bedroom in Houston: $837
- 1% lower than the median rent for the state ($848)
- 22% higher than the median rent for the region ($689)
- 12% lower than the median rent in the U.S. overall ($951)
Median rent for a 2-bedroom in Houston: $1,024
- 3% lower than the median rent for the state ($1,055)
- 21% higher than the median rent for the region ($848)
- 13% lower than the median rent in the U.S. overall ($1,180)
Year-over-year rent growth in Houston: 0.1%
- 93% lower than the state growth rate (1.5%)
- 91% lower than the regional growth rate (1.1%)
- 93% lower than the national growth rate (1.5%)
Rental vacancy rate in Houston: 8.8%
- 1% lower than the state vacancy rate (8.9%)
- 13% lower than the regional vacancy rate (10.1%)
- 28% higher than the national vacancy rate (6.9%)
Rent to cost of homeownership ratio in Houston: 0.6
- It’s 40% more affordable to rent than to buy a home in Houston
- The rent to cost of homeownership ratio is 25% lower in Houston than in the U.S. overall (0.8)
Rent as % of household income in Houston: 20.2%
- A Houston household making the median income spends 20.2% of their income on rent each month (below 30% is considered ideal)
- Rents are 31% more affordable for Houston residents than they are for U.S. residents overall (29.1%)
Houston Housing Market Statistics
Median home sales price in Houston: $235,900
- 7% lower than the national median sales price ($254,800)
Year-over-year home sales price growth in Houston: 2.7%
- 31% slower growth than the national rate (3.9%)
Home price to income ratio in Houston: 159.0
- A household making the median income can purchase a home at the median price 1.6 times over in Houston
- Homes are 5% more affordable for Houston residents than they are for U.S. residents overall (151.7)
Houston Economic Statistics
5-year projected population growth in Houston: 1.7%
- 143% faster growth than the national rate (0.7%)
5-year projected employment growth in Houston: 1.6%
- 167% faster growth than the national rate (0.6%)
Annual mean wage in Houston: $54,290
- 9% higher than the mean wage for the state ($49,720)
- 9% higher than the mean wage for the region ($43,632)
- 5% higher than the national mean wage ($51,960)
Nashville Rental Market Trends in 2019

Nashville has been growing at breakneck speed for the last several years. Since 2010, Nashville’s population has risen by 15.6%—an increase of over 260,000 residents. From July 2014 to July 2016—the peak of population growth—the metro area added 100 new residents per day.
Redfin’s latest migration report shows that there’s been a surge of interest in relocating to Nashville among residents in the country’s overheated primary markets: Los Angeles, Chicago, New York City, San Francisco, and Washington D.C. However, the city’s growth shows signs of moderating in 2019: Nashville’s 100-new-residents-per-day rate of growth slowed first to 94 people per day, then fell to 83, between July 2016 and July 2018.
Another sign of Nashville’s moderating growth is the rate at which multifamily buildings are being built and leased up. Between 2015 and 2018, 22,100 new units were constructed in Nashville—increasing the city’s apartment stock by 17.5%, while the rest of the country’s major cities grew by just 6.1%.
Though 5,000 newly constructed rentals were absorbed by the market between 2016 and 2018, demand simply hasn’t been able to keep up with Nashville’s sharp increase in supply. Between 2014 and 2016, before a glut of new units hit the market, Nashville had seen annual rent growth rates of 5 to 7%. As occupancy rates slipped below 95% at the end of 2017 (where they’ve stayed ever since), rent growth has softened to 1.5% annually. We expect to see this trend continue throughout 2019 and 2020 as an additional 1,864 units hit the market while the city’s population growth continues to moderate.
Though the pace of population growth might be slowing down—which will come as a relief to some Nashville residents—the city’s strong job market will continue to attract newcomers. In 2018, the city reported 3% year-over-year job growth as employment grew by 1.7% nationwide; and Nashville anticipates continued growth at a rate of 1.3% over the next 5 years, in comparison with 0.6% growth in the rest of the country. The number of tech jobs increased by 4.2% last year, with tech workers now representing 6.1% of Nashville’s workforce—numbers that will rise in the near future thanks to Amazon’s decision to build a 5,000-employee operations center downtown.
Though household incomes have been on the rise in this strong economy, interestingly, many higher-wage Nashville residents are still choosing to rent rather than owning their homes. The number of Nashville renter households making over $75,000 a year increased by 160% between 2010 and 2017—more than double the rate at which this demographic has increased nationwide. In response, stores, restaurants, bars, upscale apartment buildings, and mixed-use developments have sprung up in downtown Nashville to support a growing community of residents with greater discretionary income.
Nashville’s thriving downtown is attracting record-breaking numbers of tourists—and one major impact of its explosive rise in popularity is the proliferation of short-term rentals throughout the city. An estimated 4,500 short-term rentals (and an unknown number that are operating illegally) give many thousands of visitors a place to stay “like a local”—though some Nashville residents complain that a revolving door of tourists is damaging their local community and keeping thousands of units off the long-term market.
Nashville Rental Market Outlook for Property Managers & Rental Owners
Overall, things look positive for property managers and owners in Nashville. Though the oversupply of new units has softened rent growth and occupancy rates for the time being, Nashville’s strong job market and population growth will ensure continued demand from renters for the foreseeable future.
Nashville Rental Market Statistics
Median rent for a 1-bedroom in Nashville: $921
- 32% higher than the median rent for the state ($696)
- 34% higher than the median rent for the region ($689)
- 3% lower than the median rent in the U.S. overall ($951)
Median rent for a 2-bedroom in Nashville: $1,131
- 32% higher than the median rent for the state ($860)
- 33% higher than the median rent for the region ($848)
- 4% lower than the median rent in the U.S. overall ($1,180)
Year-over-year rent growth in Nashville: 1.4%
- 0% higher than the state growth rate (1.4%)
- 27% higher than the regional growth rate (1.1%)
- 7% lower than the national growth rate (1.5%)
Rental vacancy rate in Nashville: 7.5%
- 13% lower than the state vacancy rate (8.6%)
- 26% lower than the regional vacancy rate (10.1%)
- 9% higher than the national vacancy rate (6.9%)
Rent to cost of homeownership ratio in Nashville: 0.6
- It’s 40% more affordable to rent than to buy a home in Nashville
- The rent to cost of homeownership ratio is 25% lower in Nashville than in the U.S. overall (0.8)
Rent as % of household income in Nashville: 21.7%
- A Nashville household making the median income spends 21.7% of their income on rent each month (below 30% is considered ideal)
- Rents are 25% more affordable for Nashville residents than they are for U.S. residents overall (29.1%)
Nashville Housing Market Statistics
Median home sales price in Nashville: $259,300
- 2% higher than the national median sales price ($254,800)
Year-over-year home sales price growth in Nashville: 2.8%
- 28% slower growth than the national rate (3.9%)
Home price to income ratio in Nashville: 142.3
- A household making the median income can purchase a home at the median price 1.4 times over in Nashville
- Homes are 6% less affordable for Nashville residents than they are for U.S. residents overall (151.7)
Nashville Economic Statistics
5-year projected population growth in Nashville: 1.4%
- 100% faster growth than the national rate (0.7%)
5-year projected employment growth in Nashville: 1.3%
- 117% faster growth than the national rate (0.6%)
Annual mean wage in Nashville: $48,370
- 8% higher than the mean wage for the state ($44,660)
- 11% higher than the mean wage for the region ($43,632)
- 7% lower than the national mean wage ($51,960)
New Orleans Rental Market Trends in 2019

New Orleans’ challenges began long before the catastrophic failure of the city’s levees during Hurricane Katrina in 2005. Following the oil bust that hit the Gulf region hard in the 1980s, the city struggled with unemployment, as well as high crime rates and a public school system that ranked far below average on every measure.
Then the hurricane hit, submerging 80% of New Orleans, including over 110,000 homes and 20,000 businesses; displacing 400,000 residents; taking more than 1,800 lives; and exacerbating the inequality between poor and wealthy New Orleans residents—a divide that often falls along racial lines.
10 years after the storm, New Orleans’ population was still down by 25%. Those who came back following Katrina returned to a city where 1 in 4 properties was vacant or blighted. Homes owned by African-American residents were more than 3 times as likely to have flooded—a consequence of discriminatory lending practices that kept many black families from becoming homeowners until the higher ground in New Orleans had already been built up. Owners of homes in majority-minority neighborhoods who were willing to return to the city and rebuild their homes couldn’t get the financial assistance they needed, as payouts were based on appraised home values rather than rebuilding estimates.
Approximately half of New Orleans rental properties were flooded during the storm. Since landlords often had their own destroyed homes to contend with, many renters were left in limbo. At least 12,000 rental units were destroyed by flooding, many of which have yet to be rebuilt; have been replaced by construction on the higher end of the market; or have been snatched up by investors for use as short-term rentals. In addition, thousands of units of affordable housing were torn down and never rebuilt after the storm.
Residents who may have wanted to return were also kept away by the city’s shortage of jobs. New Orleans shed over 22% of its jobs during the two years following the storm. One contributing factor was the contentious decision to completely overhaul the city’s school system, which put thousands of teachers and staff members out of work. Unemployment reached its peak in October 2005 at 15.9%, while just 5.0% of U.S. residents overall were out of work; and has continued to be higher in New Orleans than the rest of the country since the economy recovered from the Great Recession in mid-2014.
In 2019, from a certain perspective, the city appears to be thriving: Tech workers and college graduates are moving in; tourists are visiting at unprecedented rates; and the school system’s reinvention has resulted in higher graduation rates and test scores. New Orleans has become known as the home of fledgling start-ups, with 64% more businesses being started in the city than in the U.S. overall—while before the storm, new businesses had formed at a rate 27% slower than the rest of the country. This development has been helped by Louisiana’s tax credits for software companies and angel investors, as well as the city’s 30 to 40% lower cost of doing business compared to cities like New York and San Francisco.
Though migration to New Orleans and Louisiana is declining overall, new residents are flocking to neighborhoods like the French Quarter, Marigny, Uptown, Bywater, Freret, and the Lower Garden District. According to Redfin’s latest migration report, many are coming from primary markets like Los Angeles, the Bay Area, Washington D.C., and New York City, where the cost of living is far higher. However, this influx of more affluent residents means that housing costs are rising faster than existing New Orleanians can afford. In the 10 years following Katrina, home prices in New Orleans climbed 46%. 59% of New Orleans renters devote more than a third of their household income to housing, and 48% of residents live more than 200% below the federal poverty line.
More than half of the city’s neighborhoods have regained over 90% of their pre-Katrina populations; and 21 New Orleans neighborhoods have more residents than they did before the storm. But the contrast is stark between neighborhoods like Lakeview—one of few majority-white neighborhoods that was ravaged by flooding, but which has been revitalized by a flurry of home and business construction in the years since—and the majority-black Lower Ninth Ward, where levee failures caused surges of water so powerful that homes were blown off their foundations, and just 37% of its residents have returned. The Lower Ninth once boasted the highest concentration of black homeownership in the city. Today, it’s still characterized by empty lots, further dragging down home values and making it hard for residents to get the financing they need to rebuild. There’s also a lingering question: How does a neighborhood grapple with the reality that it continues to be vulnerable to catastrophic flooding, but is also one of few neighborhoods where low-income residents can afford to live?
Though stories of revitalization and a growing tech market in New Orleans are attracting some real estate investors to New Orleans, there are a few concerning trends that property managers and owners should keep an eye on in 2019 and beyond:
- Rent growth: By Rent.com’s estimates, rent prices in New Orleans dropped by 11.4% between December 2017 and December 2018—the largest decrease among large U.S. cities. While this trend may be good for the large percentage of New Orleans rental households who are burdened by housing costs, it’s concerning for the local real estate industry—especially when viewed through the perspective of slowing population growth and a long-struggling job market.
- Population growth: Since 2016, both New Orleans and Louisiana have been losing residents for the first time since Hurricane Katrina. New Orleans’ population shrank by almost 1,000 residents in two years, while Louisiana’s population decreased by nearly 11,000 in a single year.
- Employment and wage growth: Over the past few decades, the number of low-wage jobs available in New Orleans has fallen by 9%, and middle-wage jobs have decreased by 24%. Though the metro gained almost 50,000 new jobs between 2010 and 2014, 7 in 10 paid less than the average local wage.
- Flood risk: Though a 350-mile risk reduction system may purport to protect greater New Orleans from ‘100-year floods,’ a home currently stands a 26% chance of being flooded over the course of a 30-year mortgage—and that’s if the system functions perfectly. The Army Corps of Engineers’ former commander admits that with the level of protection the city has been granted, “There’s still going to be a lot of people that will be inundated.”
New Orleans Rental Market Outlook for Property Managers & Rental Owners
The best chances for investment are in hot neighborhoods surrounding the French Quarter, which are attracting residents and tourists from high-cost cities that make New Orleans rentals seem like a deal. But property managers and investors should also be wary of the flooding risks that still exist—and that will only intensify—in New Orleans: A city largely built below sea level, perpetually sinking, and surrounded by water.
Here are two helpful resources for property managers and owners on protecting your properties and your residents in flood-prone areas:
- Reducing Flood Risk to Residential Buildings That Can’t Be Elevated | FEMA
- How Should We Prepare for and Respond to a Flood in Our High-Rise Building? | FirstService Residential
New Orleans Rental Market Statistics
Median rent for a 1-bedroom in New Orleans: $798
- 16% higher than the median rent for the state ($689)
- 16% higher than the median rent for the region ($689)
- 16% lower than the median rent in the U.S. overall ($951)
Median rent for a 2-bedroom in New Orleans: $967
- 16% higher than the median rent for the state ($836)
- 14% higher than the median rent for the region ($848)
- 18% lower than the median rent in the U.S. overall ($1,180)
Year-over-year rent growth in New Orleans: 0.1%
- 200% higher than the state growth rate (-0.1%)
- 91% lower than the regional growth rate (1.1%)
- 93% lower than the national growth rate (1.5%)
Rental vacancy rate in New Orleans: 9.7%
- 4% lower than the state vacancy rate (10.1%)
- 4% lower than the regional vacancy rate (10.1%)
- 41% higher than the national vacancy rate (6.9%)
Rent to cost of homeownership ratio in New Orleans: 0.7
- It’s 30% more affordable to rent than to buy a home in New Orleans
- The rent to cost of homeownership ratio is 12% lower in New Orleans than it is in the U.S. overall (0.8)
Rent as % of household income in New Orleans: 26.4%
- A New Orleans household making the median income spends 26.4% of their income on rent each month
- Rents are 9% more affordable for New Orleans residents than they are for U.S. residents overall (29.1%)
New Orleans Housing Market Statistics
Median home sales price in New Orleans: $204,500
- 20% lower than the national median sales price ($254,800)
Year-over-year home sales price growth in New Orleans: 4.6%
- 18% faster growth than the national rate (3.9%)
Home price to income ratio in New Orleans: 155.9
- A household making the median income can purchase a home at the median price 1.6 times over in New Orleans
- Homes are 3% less affordable for New Orleans residents than they are for U.S. residents overall (151.7)
New Orleans Economic Statistics
5-year projected population growth in New Orleans: 0.4%
- 43% slower growth than the national rate (0.7%)
5-year projected employment growth in New Orleans: 0.3%
- 50% slower growth than the national rate (0.6%)
Annual mean wage in New Orleans: $44,860
- 5% higher than the mean wage for the state ($42,660)
- 3% higher than the mean wage for the region ($43,632)
- 14% lower than the national mean wage ($51,960)
San Antonio Rental Market Trends in 2019

Though its growth may often be overshadowed by Austin and Dallas, San Antonio gained new residents at a rate of 17.5% between 2010 and 2018. Many of these residents are moving from other cities in Texas: 17% of Redfin users interested in moving to San Antonio currently live in Houston, 11% are from Austin, and 4% are from Dallas. However, residents of expensive primary markets like Los Angeles, Seattle, the Bay Area, Chicago, and New York City are considering moving to San Antonio as well. This led the San Antonio Current to run the headline, “Californians Are Moving to Texas, While Texans Are Moving to San Antonio.”
What appeal does San Antonio hold for residents in other cities? Though it’s growing at a faster clip than many other cities in the U.S., San Antonio’s population increase has been on a different scale than other Texas metropolises. San Antonio and Dallas both grew by the same percentage over the last 8 years; but Dallas—a city of 7.5 million—added 1,114,000 new residents, while San Antonio’s population increased by 376,600, to 2.5 million total residents. For those who have experienced the feverish growth (and the inevitable growing pains) of a city like Austin, or who have weathered hurricanes and fluctuating oil prices in Houston, San Antonio may provide a welcome respite.
In addition, San Antonio has experienced strong job growth in recent years. Though it still lags behind other cities in attracting tech workers, companies like Boeing, Hulu, TJX, and Ernst & Young have made moves to expand their numbers of employees located in San Antonio. USAA began moving its tech workers downtown in 2018, reflecting the increasing appeal of San Antonio’s downtown neighborhoods to businesses and developers. The University of Texas at San Antonio plans to grow its downtown campus from 4,000 students to 15,000 in the next decade, and has expanded departments focused on up-and-coming employment areas like data science and cybersecurity. In response, multifamily construction is shifting from the suburbs to Central San Antonio, buoyed by incentives from the city to help the neighborhood reach its goal of 7,500 new housing units by 2020.
San Antonio Rental Market Outlook for Property Managers & Rental Owners
Though rent and home price growth have been strong, San Antonio remains the most affordable of Texas’ large cities. As population and employment growth continue to drive demand for rentals in San Antonio and its suburbs, we expect rent growth and occupancy rates to stay strong. For property managers and owners looking for a less competitive, high-opportunity market, San Antonio may be a wise choice in 2019 and beyond.
San Antonio Rental Market Statistics
Median rent for a 1-bedroom in San Antonio: $853
- 1% higher than the median rent for the state ($848)
- 24% higher than the median rent for the region ($689)
- 10% lower than the median rent in the U.S. overall ($951)
Median rent for a 2-bedroom in San Antonio: $1,073
- 2% higher than the median rent for the state ($1,055)
- 27% higher than the median rent for the region ($848)
- 9% lower than the median rent in the U.S. overall ($1,180)
Year-over-year rent growth in San Antonio: 2.4%
- 60% higher than the state growth rate (1.5%)
- 118% higher than the regional growth rate (1.1%)
- 60% higher than the national growth rate (1.5%)
Rental vacancy rate in San Antonio: 7.4%
- 17% lower than the state vacancy rate (8.9%)
- 27% lower than the regional vacancy rate (10.1%)
- 7% higher than the national vacancy rate (6.9%)
Rent to cost of homeownership ratio in San Antonio: 0.8
- It’s 20% more affordable to rent than to buy a home in San Antonio
- The rent to cost of homeownership ratio is the same in San Antonio as it is in the U.S. overall (0.8)
Rent as % of household income in San Antonio: 29.1%
- A San Antonio household making the median income spends 29.1% of their income on rent each month (below 30% is considered ideal)
- Rents are as affordable for San Antonio residents as they are for U.S. residents overall (29.1%)
San Antonio Housing Market Statistics
Median home sales price in San Antonio: $226,500
- 11% lower than the national median sales price ($254,800)
Year-over-year home sales price growth in San Antonio: 3.5%
- 10% slower growth than the national rate (3.9%)
Home price to income ratio in San Antonio: 151.7
- A household making the median income can purchase a home at the median price 1.5 times over in San Antonio
- Homes are as affordable for San Antonio residents as they are for U.S. residents overall (151.7)
San Antonio Economic Statistics
5-year projected population growth in San Antonio: 1.7%
- 143% faster growth than the national rate (0.7%)
5-year projected employment growth in San Antonio: 1.3%
- 117% faster growth than the national rate (0.6%)
Annual mean wage in San Antonio: $46,650
- 6% lower than the mean wage for the state ($49,720)
- 7% higher than the mean wage for the region ($43,632)
- 10% lower than the national mean wage ($51,960)
Rental Trends in the South Central U.S.

Why Residents Move to the South Central U.S.
In our survey of U.S. renters, a typical resident of the South Central U.S. moved to their current metro area in 2016, and has moved approximately twice in the last five years. The most common reasons why they moved to their current city were to be close to the people they care about (35%), to attend school (21%), or for career opportunities (19%).
Where Renters Live in the South Central U.S.
In the South Central U.S., it’s most common for renters to live in single-family homes (40%) and large apartment buildings (24%). 52% of renters live in the suburbs, 27% live downtown, and 21% live in rural areas.
In Their Own Words: How South Central U.S. Residents Want Their Rental to Make Them Feel
We asked renters to complete the sentence: “I want my rental to make me feel…”
- “Like it’s possible to live on my own without being stressed out over how I’m going to afford everything.”
- “Like it’s my home, in a community that I want to be a part of.”
- “Like I’m independent but still have the flexibility of not paying a mortgage.”
- “Like I’m able to get to know my neighbors, but we all have our own private space.”
Attracting & Retaining Renters in the South Central U.S.

In our survey of U.S. renters, 34% of South Central U.S. renters plan on renewing their lease for another year; 30% plan on moving; and 36% are on the fence about whether to stay or go. 53% would prefer owning their home to renting, but they feel that they’re not in a position to buy right now. Only 1 in 5 South Central U.S. renters plan on buying their own home in the near future—likely due to the affordable cost of renting.
Most-Wanted Amenities Among Renters in the South Central U.S.
More than half of South Central U.S. renters say that these neighborhood qualities would influence their choice of one rental over another:
- A safe neighborhood – selected by 74% of respondents
- Proximity to work, school, or transportation – 66%
- Proximity to stores and restaurants – 58%
- A quiet neighborhood – 55%
Over 40% of South Central U.S. renters say that these building amenities would impact their choice of one rental over another:
- High-speed internet – selected by 65%
- Garbage pick-up – 48%
- A pool – 46%
- A fitness center – 45%
- A patio or roof deck – 40%
- A backyard – 40%
1 in 2 South Central U.S. renters say that these unit amenities would affect their choice of one rental over another:
- Central air conditioning – 61%
- Being allowed to have a pet – 55%
- A walk-in closet – 52%
- An in-unit washer and dryer – 51%