

View our 2025 list of up-and-coming real estate markets where property managers and rental investors can grow.
In years past, our annual list of up-and-coming real estate markets has been dominated by Sun Belt cities such as Austin, Raleigh, Charlotte, and Nashville.
That’s about to change.
Record numbers of apartments have come online in many of our top real estate market picks from previous years, causing rent growth to slow and vacancy rates to rise.
In response, we’re looking toward smaller cities in new regions for a combination of growth and affordability heading into the new year.
Where are 2024’s up-and-coming real estate markets located? In the Midwest, Mid-Atlantic, New England, and South Central regions of the U.S.
Frequently mentioned states in this year’s list include Pennsylvania, Wisconsin, Ohio, and Michigan.
How Do We Identify Up-and-Coming Real Estate Markets?
So, how did we arrive at these results?
First, we examined tried-and-true lists of top-performing and emerging real estate markets from the Wall Street Journal, Realtor.com, PricewaterhouseCoopers, the Urban Land Institute, and U.S. News.
Second, we dove into thousands of data points from the National Association of Realtors to analyze every rental market across the country on measures of rent growth, occupancy, property price appreciation, population growth, and more.
With that said, here’s what you’ll find in this post:
- Best Real Estate Markets in Each Category: The top 5 cities when it comes to cap rates, rent growth, vacancy rates, and home price appreciation
- Top 60 Up-and-Coming Real Estate Markets 2024: Stats on each of our picks to help you assess the opportunity in each city
- Methodology: The sources from which all of our data was derived, plus a full list of the measures included in our analysis
Cheers to your growth in 2024!
Best Real Estate Markets in Each Category
Dive into data-backed insights for the best real estate markets when it comes to cap rates, rent growth, vacancy rates, and home price appreciation.
Note: These rankings apply solely to the markets on our list.
Rental Markets with the Most Rent Growth in 2023
Source: National Association of Realtors – asking rent growth in market-rate multifamily units between Q2-2022 and Q2-2023
Rental Markets with the Lowest Vacancy Rates in 2023
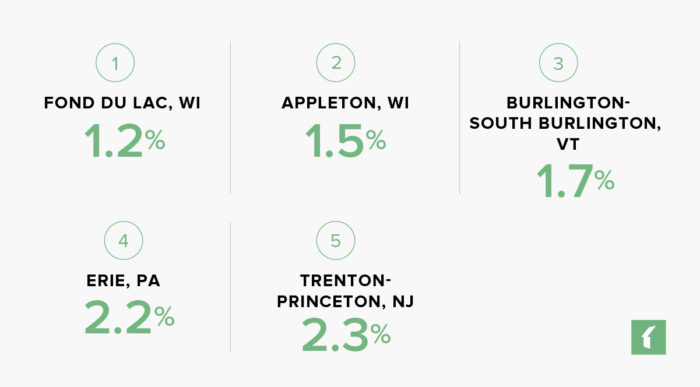
Source: National Association of Realtors – multifamily vacancy rate as of Q2-2023
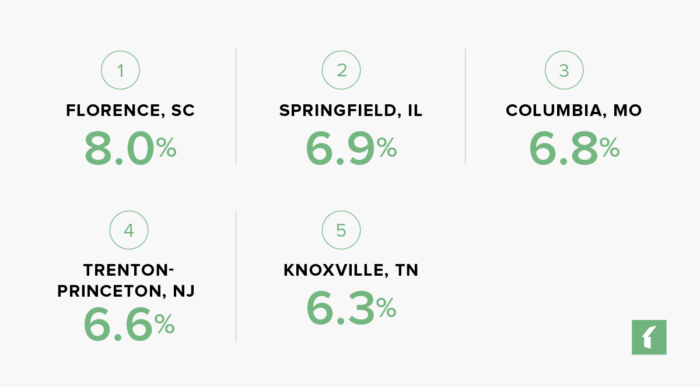
Rental Markets with the Highest Cap Rates in 2023
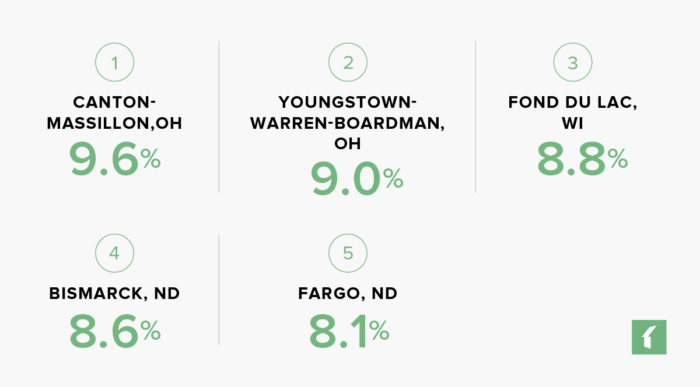
Source: National Association of Realtors – cap rate in market-rate multifamily units as of Q2-2023
Real Estate Markets with the Most Home Price Growth in 2023
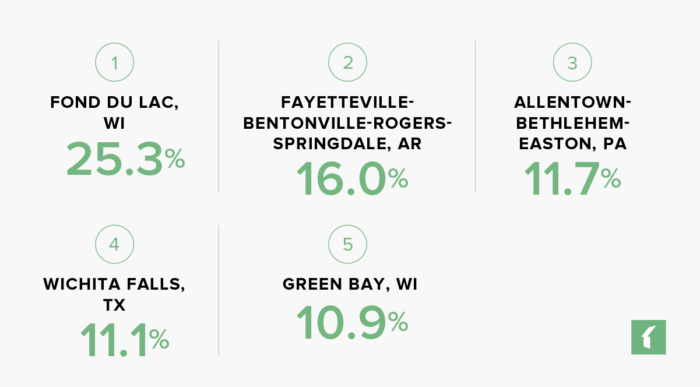
Source: National Association of Realtors – median home price appreciation between Q2-2022 and Q2-2023
Top 60 Up-and-Coming Real Estate Markets 2024
#1: Fayetteville, AR
Fayetteville-Springdale-Rogers, AR Metro Area Population: 576,724
Fayetteville, AR Rental Market Statistics:
Rental Inventory (Q2-‘23): 39,250
Units Added Since Q2-‘22: +1,663
Asking Rent Growth Since Q2-‘22: 4.6%
Asking Rent (Q2-‘23): $1,038
Effective Rent (Q2-‘23): $1,032
Multifamily Vacancy Rate (Q2-‘23): 5.5%
Multifamily Cap Rate (Q2-‘23): 5.8%
Source: National Association of Realtors
Fayetteville, AR Housing Market Statistics:
Median Home Price (Q2-‘23): $356,000
Home Price Appreciation Since Q2-‘22: 16%
Source: National Association of Realtors
Lists That Mention Fayetteville, AR:
Emerging Housing Markets Index – Fall 2023 (WSJ/Realtor.com): #163
Best Places to Live – 2023-2024 (U.S. News): #10
Fastest-Growing Real Estate Markets – 2023-2024 (U.S. News): #15
#2: Fargo, ND
Fargo, ND-MN Metro Area Population: 258,663
Fargo, ND Rental Market Statistics:
Rental Inventory (Q2-‘23): 37,281
Units Added Since Q2-‘22: +394
Asking Rent Growth Since Q2-‘22: 5.6%
Asking Rent (Q2-‘23): $979
Effective Rent (Q2-‘23): $975
Multifamily Vacancy Rate (Q2-‘23): 5.2%
Multifamily Cap Rate (Q2-‘23): 8.1%
Source: National Association of Realtors
Fargo, ND Housing Market Statistics:
Median Home Price (Q2-‘23): $300,800
Home Price Appreciation Since Q2-‘22: 3.9%
Source: National Association of Realtors
Lists That Mention Fargo, ND:
Emerging Housing Markets Index – Fall 2023 (WSJ/Realtor.com): #253
#3: Knoxville, TN
Knoxville, TN Metro Area Population: 906,674
Knoxville, TN Rental Market Statistics:
Rental Inventory (Q2-‘23): 41,571
Units Added Since Q2-‘22: +624
Asking Rent Growth Since Q2-‘22: 6.3%
Asking Rent (Q2-‘23): $1,376
Effective Rent (Q2-‘23): $1,370
Multifamily Vacancy Rate (Q2-‘23): 4.8%
Multifamily Cap Rate (Q2-‘23): 5.8%
Source: National Association of Realtors
Knoxville, TN Housing Market Statistics:
Median Home Price (Q2-‘23): $342,400
Home Price Appreciation Since Q2-‘22: 1.9%
Source: National Association of Realtors
Lists That Mention Knoxville, TN:
Markets to Watch – Overall Real Estate Prospects 2024 (PwC/ULI): #61
Emerging Housing Markets Index – Fall 2023 (WSJ/Realtor.com): #18
Best Places to Live – 2023-2024 (U.S. News): #21
Fastest-Growing Real Estate Markets – 2023-2024 (U.S. News): #16
Top-Rated Cities for Multifamily Investment 2024 (PwC/ULI): #4
#4: Sioux Falls, SD
Sioux Falls, SD Metro Area Population: 289,295
Sioux Falls, SD Rental Market Statistics:
Rental Inventory (Q2-‘23): 26,191
Units Added Since Q2-‘22: +1,028
Asking Rent Growth Since Q2-‘22: 1.8%
Asking Rent (Q2-‘23): $1,077
Effective Rent (Q2-‘23): $1,067
Multifamily Vacancy Rate (Q2-‘23): 11.1%
Multifamily Cap Rate (Q2-‘23): 6.8%
Source: National Association of Realtors
Sioux Falls, SD Housing Market Statistics:
Median Home Price (Q2-‘23): $341,400
Home Price Appreciation Since Q2-‘22: 4.7%
Source: National Association of Realtors
Lists That Mention Sioux Falls, SD:
Emerging Housing Markets Index – Fall 2023 (WSJ/Realtor.com): #197
#5: Youngstown, OH
Youngstown-Warren-Boardman, OH-PA Metro Area Population: 535,499
Youngstown, OH Rental Market Statistics:
Rental Inventory (Q2-‘23): 17,998
Units Added Since Q2-‘22: +0
Asking Rent Growth Since Q2-‘22: 5.3%
Asking Rent (Q2-‘23): $782
Effective Rent (Q2-‘23): $780
Multifamily Vacancy Rate (Q2-‘23): 5.0%
Multifamily Cap Rate (Q2-‘23): 9.0%
Source: National Association of Realtors
Youngstown, OH Housing Market Statistics:
Median Home Price (Q2-‘23): $157,300
Home Price Appreciation Since Q2-‘22: 9.8%
Source: National Association of Realtors
Lists That Mention Youngstown, OH:
Emerging Housing Markets Index – Fall 2023 (WSJ/Realtor.com): #82
Best Places to Live – 2023-2024 (U.S. News): #62
#6: Lincoln, NE
Lincoln, NE Metro Area Population: 341,229
Lincoln, NE Rental Market Statistics:
Rental Inventory (Q2-‘23): 30,705
Units Added Since Q2-‘22: +293
Asking Rent Growth Since Q2-‘22: 6.1%
Asking Rent (Q2-‘23): $1,110
Effective Rent (Q2-‘23): $1,104
Multifamily Vacancy Rate (Q2-‘23): 4.5%
Multifamily Cap Rate (Q2-‘23): 7.1%
Source: National Association of Realtors
Lincoln, NE Housing Market Statistics:
Median Home Price (Q2-‘23): $292,700
Home Price Appreciation Since Q2-‘22: 4.2%
Source: National Association of Realtors
Lists That Mention Lincoln, NE:
Emerging Housing Markets Index – Fall 2023 (WSJ/Realtor.com): #138
Best Places to Live – 2023-2024 (U.S. News): #32
#7: Manchester, NH
Manchester-Nashua, NH Metro Area Population: 426,594
Manchester, NH Rental Market Statistics:
Rental Inventory (Q2-‘23): 22,514
Units Added Since Q2-‘22: +90
Asking Rent Growth Since Q2-‘22: 2.8%
Asking Rent (Q2-‘23): $1,919
Effective Rent (Q2-‘23): $1,913
Multifamily Vacancy Rate (Q2-‘23): 3.0%
Multifamily Cap Rate (Q2-‘23): 5.8%
Source: National Association of Realtors
Manchester, NH Housing Market Statistics:
Median Home Price (Q2-‘23): $489,500
Home Price Appreciation Since Q2-‘22: 0.8%
Source: National Association of Realtors
Lists That Mention Manchester, NH:
Emerging Housing Markets Index – Fall 2023 (WSJ/Realtor.com): #7
Best Places to Live – 2023-2024 (U.S. News): #51
#8: Fort Wayne, IN
Fort Wayne, IN Metro Area Population: 426,076
Fort Wayne, IN Rental Market Statistics:
Rental Inventory (Q2-‘23): 23,502
Units Added Since Q2-‘22: +0
Asking Rent Growth Since Q2-‘22: 0.2%
Asking Rent (Q2-‘23): $1,004
Effective Rent (Q2-‘23): $999
Multifamily Vacancy Rate (Q2-‘23): 5.7%
Multifamily Cap Rate (Q2-‘23): 6.6%
Source: National Association of Realtors
Fort Wayne, IN Housing Market Statistics:
Median Home Price (Q2-‘23): $236,600
Home Price Appreciation Since Q2-‘22: 5.9%
Source: National Association of Realtors
Lists That Mention Fort Wayne, IN:
Emerging Housing Markets Index – Fall 2023 (WSJ/Realtor.com): #4
Best Places to Live – 2023-2024 (U.S. News): #33
#9: Columbia, MO
Columbia, MO Metro Area Population: 214,749
Columbia, MO Rental Market Statistics:
Rental Inventory (Q2-‘23): 11,416
Units Added Since Q2-‘22: +0
Asking Rent Growth Since Q2-‘22: 6.8%
Asking Rent (Q2-‘23): $1,007
Effective Rent (Q2-‘23): $1,003
Multifamily Vacancy Rate (Q2-‘23): 2.7%
Multifamily Cap Rate (Q2-‘23): 7.7%
Source: National Association of Realtors
Columbia, MO Housing Market Statistics:
Median Home Price (Q2-‘23): $310,100
Home Price Appreciation Since Q2-‘22: 2.0%
Source: National Association of Realtors
Lists That Mention Columbia, MO:
Emerging Housing Markets Index – Fall 2023 (WSJ/Realtor.com): #53
#10: Ann Arbor, MI
Ann Arbor, MI Metro Area Population: 366,376
Ann Arbor, MI Rental Market Statistics:
Rental Inventory (Q2-‘23): 30,978
Units Added Since Q2-‘22: +0
Asking Rent Growth Since Q2-‘22: 4.4%
Asking Rent (Q2-‘23): $1,508
Effective Rent (Q2-‘23): $1,498
Multifamily Vacancy Rate (Q2-‘23): 4.9%
Multifamily Cap Rate (Q2-‘23): 6.1%
Source: National Association of Realtors
Ann Arbor, MI Housing Market Statistics:
Median Home Price (Q2-‘23): $428,500
Home Price Appreciation Since Q2-‘22: 4.8%
Source: National Association of Realtors
Lists That Mention Ann Arbor, MI:
Emerging Housing Markets Index – Fall 2023 (WSJ/Realtor.com): #56
Best Places to Live – 2023-2024 (U.S. News): #14
#11: Trenton, NJ
Trenton-Princeton, NJ Metro Area Population: 380,688
Trenton, NJ Rental Market Statistics:
Rental Inventory (Q2-‘23): 20,247
Units Added Since Q2-‘22: +820
Asking Rent Growth Since Q2-‘22: 6.6%
Asking Rent (Q2-‘23): $2,038
Effective Rent (Q2-‘23): $2,031
Multifamily Vacancy Rate (Q2-‘23): 2.3%
Multifamily Cap Rate (Q2-‘23): 5.0%
Source: National Association of Realtors
Trenton, NJ Housing Market Statistics:
Median Home Price (Q2-‘23): $409,400
Home Price Appreciation Since Q2-‘22: 10.5%
Source: National Association of Realtors
Lists That Mention Trenton, NJ:
Emerging Housing Markets Index – Fall 2023 (WSJ/Realtor.com): #38
Best Places to Live – 2023-2024 (U.S. News): #71
#12: Green Bay, WI
Green Bay, WI Metro Area Population: 330,292
Green Bay, WI Rental Market Statistics:
Rental Inventory (Q2-‘23): 21,429
Units Added Since Q2-‘22: +88
Asking Rent Growth Since Q2-‘22: 5.5%
Asking Rent (Q2-‘23): $1,010
Effective Rent (Q2-‘23): $1,006
Multifamily Vacancy Rate (Q2-‘23): 2.6%
Multifamily Cap Rate (Q2-‘23): 7.7%
Source: National Association of Realtors
Green Bay, WI Housing Market Statistics:
Median Home Price (Q2-‘23): $296,400
Home Price Appreciation Since Q2-‘22: 10.9%
Source: National Association of Realtors
Lists That Mention Green Bay, WI:
Emerging Housing Markets Index – Fall 2023 (WSJ/Realtor.com): #143
Best Places to Live – 2023-2024 (U.S. News): #1
#13: Fond du Lac, WI
Fond du Lac, WI Metro Area Population: 103,836
Fond du Lac, WI Rental Market Statistics:
Rental Inventory (Q2-‘23): 4,492
Units Added Since Q2-‘22: +0
Asking Rent Growth Since Q2-‘22: 2.4%
Asking Rent (Q2-‘23): $908
Effective Rent (Q2-‘23): $906
Multifamily Vacancy Rate (Q2-‘23): 1.2%
Multifamily Cap Rate (Q2-‘23): 8.8%
Source: National Association of Realtors
Fond du Lac, WI Housing Market Statistics:
Median Home Price (Q2-‘23): $243,400
Home Price Appreciation Since Q2-‘22: 25.3%
Source: National Association of Realtors
#14: Cincinnati, OH
Cincinnati, OH-KY-IN Metro Area Population: 2,268,393
Cincinnati, OH Rental Market Statistics:
Rental Inventory (Q2-‘23): 137,755
Units Added Since Q2-‘22: +778
Asking Rent Growth Since Q2-‘22: 4.6%
Asking Rent (Q2-‘23): $1,202
Effective Rent (Q2-‘23): $1,194
Multifamily Vacancy Rate (Q2-‘23): 5.7%
Multifamily Cap Rate (Q2-‘23): 7.0%
Source: National Association of Realtors
Cincinnati, OH Housing Market Statistics:
Median Home Price (Q2-‘23): $294,200
Home Price Appreciation Since Q2-‘22: 5.9%
Source: National Association of Realtors
Lists That Mention Cincinnati, OH:
Markets to Watch – Overall Real Estate Prospects 2024 (PwC/ULI): #66
Emerging Housing Markets Index – Fall 2023 (WSJ/Realtor.com): #31
Best Places to Live – 2023-2024 (U.S. News): #50
#15: Cape Coral, FL
Cape Coral-Fort Myers, FL Metro Area Population: 822,453
Cape Coral, FL Rental Market Statistics
Rental Inventory (Q2-‘23): 29,114
Units Added Since Q2-‘22: +0
Asking Rent Growth Since Q2-‘22: 0.5%
Asking Rent (Q2-‘23): $1,878
Effective Rent (Q2-‘23): $1,853
Multifamily Vacancy Rate (Q2-‘23): 8.3%
Multifamily Cap Rate (Q2-‘23): 4.9%
Source: National Association of Realtors
Cape Coral, FL Housing Market Statistics:
Median Home Price (Q2-‘23): $439,000
Home Price Appreciation Since Q2-‘22: -4.6%
Source: National Association of Realtors
Lists That Mention Cape Coral, FL:
Markets to Watch – Overall Real Estate Prospects 2024 (PwC/ULI): #44
Emerging Housing Markets Index – Fall 2023 (WSJ/Realtor.com): #277
Fastest-Growing Real Estate Markets – 2023-2024 (U.S. News): #3
#16: Madison, WI
Madison, WI Metro Area Population: 687,077
Madison, WI Rental Market Statistics:
Rental Inventory (Q2-‘23): 69,657
Units Added Since Q2-‘22: +1,246
Asking Rent Growth Since Q2-‘22: 6.2%
Asking Rent (Q2-‘23): $1,470
Effective Rent (Q2-‘23): $1,464
Multifamily Vacancy Rate (Q2-‘23): 3.4%
Multifamily Cap Rate (Q2-‘23): 5.8%
Source: National Association of Realtors
Madison, WI Housing Market Statistics:
Median Home Price (Q2-‘23): $429,200
Home Price Appreciation Since Q2-‘22: 4.7%
Source: National Association of Realtors
Lists That Mention Madison, WI:
Markets to Watch – Overall Real Estate Prospects 2024 (PwC/ULI): #79
Emerging Housing Markets Index – Fall 2023 (WSJ/Realtor.com): #61
Best Places to Live – 2023-2024 (U.S. News): #11
Top-Rated Cities for Multifamily Investment 2024 (PwC/ULI): #2
#17: Portland, ME
Portland-South Portland, ME Metro Area Population: 561,576
Portland, ME Rental Market Statistics:
Rental Inventory (Q2-‘23): 16,067
Units Added Since Q2-‘22: +36
Asking Rent Growth Since Q2-‘22: 3.7%
Asking Rent (Q2-‘23): $1,785
Effective Rent (Q2-‘23): $1,779
Multifamily Vacancy Rate (Q2-‘23): 3.0%
Multifamily Cap Rate (Q2-‘23): 6.7%
Source: National Association of Realtors
Portland, ME Housing Market Statistics:
Median Home Price (Q2-‘23): $538,700
Home Price Appreciation Since Q2-‘22: 9.1%
Source: National Association of Realtors
Lists That Mention Portland, ME:
Markets to Watch – Overall Real Estate Prospects 2024 (PwC/ULI): #74
Emerging Housing Markets Index – Fall 2023 (WSJ/Realtor.com): #22
Best Places to Live – 2023-2024 (U.S. News): #7
Fastest-Growing Real Estate Markets – 2023-2024 (U.S. News): #24
#18: Worcester, MA
Worcester, MA-CT Metro Area Population: 980,836
Worcester, MA Rental Market Statistics:
Rental Inventory (Q2-‘23): 29,861
Units Added Since Q2-‘22: +159
Asking Rent Growth Since Q2-‘22: 4.7%
Asking Rent (Q2-‘23): $1,849
Effective Rent (Q2-‘23): $1,837
Multifamily Vacancy Rate (Q2-‘23): 3.5%
Multifamily Cap Rate (Q2-‘23): 5.8%
Source: National Association of Realtors
Worcester, MA Housing Market Statistics:
Median Home Price (Q2-‘23): $452,000
Home Price Appreciation Since Q2-‘22: 6.3%
Source: National Association of Realtors
Lists That Mention Worcester, MA:
Emerging Housing Markets Index – Fall 2023 (WSJ/Realtor.com): #20
Best Places to Live – 2023-2024 (U.S. News): #77
#19: Albany, NY
Albany-Schenectady-Troy, NY Metro Area Population: 904,617
Albany, NY Rental Market Statistics:
Rental Inventory (Q2-‘23): 55,500
Units Added Since Q2-‘22: +331
Asking Rent Growth Since Q2-‘22: 4.3%
Asking Rent (Q2-‘23): $1,515
Effective Rent (Q2-‘23): $1,508
Multifamily Vacancy Rate (Q2-‘23): 4.4%
Multifamily Cap Rate (Q2-‘23): 6.7%
Source: National Association of Realtors
Albany, NY Housing Market Statistics:
Median Home Price (Q2-‘23): $296,300
Home Price Appreciation Since Q2-‘22: 3.7%
Source: National Association of Realtors
Lists That Mention Albany, NY:
Emerging Housing Markets Index – Fall 2023 (WSJ/Realtor.com): #223
Best Places to Live – 2023-2024 (U.S. News): #17
#20: Syracuse, NY
Syracuse, NY Metro Area Population: 653,633
Syracuse, NY Rental Market Statistics:
Rental Inventory (Q2-‘23): 33,290
Units Added Since Q2-‘22: +0
Asking Rent Growth Since Q2-‘22: 4.9%
Asking Rent (Q2-‘23): $1,179
Effective Rent (Q2-‘23): $1,173
Multifamily Vacancy Rate (Q2-‘23): 4.5%
Multifamily Cap Rate (Q2-‘23): 7.2%
Source: National Association of Realtors
Syracuse, NY Housing Market Statistics:
Median Home Price (Q2-‘23): $211,600
Home Price Appreciation Since Q2-‘22: 7.8%
Source: National Association of Realtors
Lists That Mention Syracuse, NY:
Emerging Housing Markets Index – Fall 2023 (WSJ/Realtor.com): #170
Best Places to Live – 2023-2024 (U.S. News): #22
#21: Mobile, AL
Mobile, AL Metro Area Population: 428,780
Mobile, AL Rental Market Statistics:
Rental Inventory (Q2-‘23): 21,211
Units Added Since Q2-‘22: +0
Asking Rent Growth Since Q2-‘22: 5.0%
Asking Rent (Q2-‘23): $1,052
Effective Rent (Q2-‘23): $1,046
Multifamily Vacancy Rate (Q2-‘23): 7.7%
Multifamily Cap Rate (Q2-‘23): 6.2%
Source: National Association of Realtors
Mobile, AL Housing Market Statistics:
Median Home Price (Q2-‘23): $228,700
Home Price Appreciation Since Q2-‘22: 4.2%
Source: National Association of Realtors
Lists That Mention Mobile, AL:
Emerging Housing Markets Index – Fall 2023 (WSJ/Realtor.com): #129
Best Places to Live – 2023-2024 (U.S. News): #115
#22: Tallahassee, FL
Tallahassee, FL Metro Area Population: 391,680
Tallahassee, FL Rental Market Statistics:
Rental Inventory (Q2-‘23): 22,142
Units Added Since Q2-‘22: +264
Asking Rent Growth Since Q2-‘22: 1.9%
Asking Rent (Q2-‘23): $1,309
Effective Rent (Q2-‘23): $1,300
Multifamily Vacancy Rate (Q2-‘23): 8.6%
Multifamily Cap Rate (Q2-‘23): 5.9%
Source: National Association of Realtors
Tallahassee, FL Housing Market Statistics:
Median Home Price (Q2-‘23): $332,000
Home Price Appreciation Since Q2-‘22: 7.1%
Source: National Association of Realtors
Lists That Mention Tallahassee, FL:
Markets to Watch – Overall Real Estate Prospects 2024 (PwC/ULI): #59
Emerging Housing Markets Index – Fall 2023 (WSJ/Realtor.com): #114
Best Places to Live – 2023-2024 (U.S. News): #60
#23: Sherman, TX
Sherman-Denison, TX Metro Area Population: 143,131
Sherman, TX Rental Market Statistics:
Rental Inventory (Q2-‘23): 5,856
Units Added Since Q2-‘22: +0
Asking Rent Growth Since Q2-‘22: 6.2%
Asking Rent (Q2-‘23): $1,098
Effective Rent (Q2-‘23): $1,092
Multifamily Vacancy Rate (Q2-‘23): 5.8%
Multifamily Cap Rate (Q2-‘23): 5.7%
Source: National Association of Realtors
Sherman, TX Housing Market Statistics:
Median Home Price (Q2-‘23): $296,200
Home Price Appreciation Since Q2-‘22: 2.7%
Source: National Association of Realtors
#24: Gainesville, FL
Gainesville, FL Metro Area Population: 350,903
Gainesville, FL Rental Market Statistics:
Rental Inventory (Q2-‘23): 25,364
Units Added Since Q2-‘22: +0
Asking Rent Growth Since Q2-‘22: 4.0%
Asking Rent (Q2-‘23): $1,397
Effective Rent (Q2-‘23): $1,389
Multifamily Vacancy Rate (Q2-‘23): 6.7%
Multifamily Cap Rate (Q2-‘23): 5.6%
Source: National Association of Realtors
Gainesville, FL Housing Market Statistics:
Median Home Price (Q2-‘23): $366,000
Home Price Appreciation Since Q2-‘22: 2.4%
Source: National Association of Realtors
Lists That Mention Gainesville, FL:
Markets to Watch – Overall Real Estate Prospects 2024 (PwC/ULI): #78
Emerging Housing Markets Index – Fall 2023 (WSJ/Realtor.com): #214
#25: Pittsburgh, PA
Pittsburgh, PA Metro Area Population: 2,349,172
Pittsburgh, PA Rental Market Statistics:
Rental Inventory (Q2-‘23): 103,444
Units Added Since Q2-‘22: +901
Asking Rent Growth Since Q2-‘22: 2.2%
Asking Rent (Q2-‘23): $1,295
Effective Rent (Q2-‘23): $1,283
Multifamily Vacancy Rate (Q2-‘23): 6.3%
Multifamily Cap Rate (Q2-‘23): 6.9%
Source: National Association of Realtors
Pittsburgh, PA Housing Market Statistics:
Median Home Price (Q2-‘23): $225,900
Home Price Appreciation Since Q2-‘22: 0.3%
Source: National Association of Realtors
Lists That Mention Pittsburgh, PA:
Markets to Watch – Overall Real Estate Prospects 2024 (PwC/ULI): #42
Emerging Housing Markets Index – Fall 2023 (WSJ/Realtor.com): #231
Best Places to Live – 2023-2024 (U.S. News): #47
Top-Rated Cities for Multifamily Investment 2024 (PwC/ULI): #5
#26: Rochester, NY
Rochester, NY Metro Area Population: 1,081,152
Rochester, NY Rental Market Statistics:
Rental Inventory (Q2-‘23): 56,767
Units Added Since Q2-‘22: +65
Asking Rent Growth Since Q2-‘22: 4.6%
Asking Rent (Q2-‘23): $1,331
Effective Rent (Q2-‘23): $1,325
Multifamily Vacancy Rate (Q2-‘23): 3.8%
Multifamily Cap Rate (Q2-‘23): 7.0%
Source: National Association of Realtors
Rochester, NY Housing Market Statistics:
Median Home Price (Q2-‘23): $240,600
Home Price Appreciation Since Q2-‘22: 8%
Source: National Association of Realtors
Lists That Mention Rochester, NY:
Emerging Housing Markets Index – Fall 2023 (WSJ/Realtor.com): #33
Best Places to Live – 2023-2024 (U.S. News): #26
#27: Allentown, PA
Allentown-Bethlehem-Easton, PA-NJ Metro Area Population: 871,229
Allentown, PA Rental Market Statistics:
Rental Inventory (Q2-‘23): 34,586
Units Added Since Q2-‘22: +180
Asking Rent Growth Since Q2-‘22: 2.9%
Asking Rent (Q2-‘23): $1,582
Effective Rent (Q2-‘23): $1,574
Multifamily Vacancy Rate (Q2-‘23): 3.5%
Multifamily Cap Rate (Q2-‘23): 6.3%
Source: National Association of Realtors
Allentown, PA Housing Market Statistics:
Median Home Price (Q2-‘23): $330,700
Home Price Appreciation Since Q2-‘22: 11.7%
Source: National Association of Realtors
Lists That Mention Allentown, PA:
Emerging Housing Markets Index – Fall 2023 (WSJ/Realtor.com): #52
Best Places to Live – 2023-2024 (U.S. News): #109
#28: Springfield, MO
Springfield, MO Metro Area Population: 484,613
Springfield, MO Rental Market Statistics:
Rental Inventory (Q2-‘23): 24,016
Units Added Since Q2-‘22: +314
Asking Rent Growth Since Q2-‘22: 3.3%
Asking Rent (Q2-‘23): $867
Effective Rent (Q2-‘23): $864
Multifamily Vacancy Rate (Q2-‘23): 3.5%
Multifamily Cap Rate (Q2-‘23): 7.1%
Source: National Association of Realtors
Springfield, MO Housing Market Statistics:
Median Home Price (Q2-‘23): $247,000
Home Price Appreciation Since Q2-‘22: 1.4%
Source: National Association of Realtors
Lists That Mention Springfield, MO:
Emerging Housing Markets Index – Fall 2023 (WSJ/Realtor.com): #46
Best Places to Live – 2023-2024 (U.S. News): #57
#29: Bloomington, IL
Bloomington, IL Metro Area Population: 171,141
Bloomington, IL Rental Market Statistics:
Rental Inventory (Q2-‘23): 9,465
Units Added Since Q2-‘22: +0
Asking Rent Growth Since Q2-‘22: 5.6%
Asking Rent (Q2-‘23): $1,042
Effective Rent (Q2-‘23): $1,038
Multifamily Vacancy Rate (Q2-‘23): 3.2%
Multifamily Cap Rate (Q2-‘23): 7.3%
Source: National Association of Realtors
Bloomington, IL Housing Market Statistics:
Median Home Price (Q2-‘23): $239,000
Home Price Appreciation Since Q2-‘22: 9.0%
Source: National Association of Realtors
Lists That Mention Bloomington, IL:
Emerging Housing Markets Index – Fall 2023 (WSJ/Realtor.com): #29
#30: Canton, OH
Canton-Massillon, OH Metro Area Population: 399,316
Canton, OH Rental Market Statistics:
Rental Inventory (Q2-‘23): 12,679
Units Added Since Q2-‘22: +0
Asking Rent Growth Since Q2-‘22: 3.7%
Asking Rent (Q2-‘23): $874
Effective Rent (Q2-‘23): $870
Multifamily Vacancy Rate (Q2-‘23): 5.3%
Multifamily Cap Rate (Q2-‘23): 9.6%
Source: National Association of Realtors
Canton, OH Housing Market Statistics:
Median Home Price (Q2-‘23): $188,800
Home Price Appreciation Since Q2-‘22: 5.2%
Source: National Association of Realtors
Lists That Mention Canton, OH:
Emerging Housing Markets Index – Fall 2023 (WSJ/Realtor.com): #17
#31: Hagerstown, MD
Hagerstown-Martinsburg, MD-WV Metro Area Population: 303,665
Hagerstown, MD Rental Market Statistics:
Rental Inventory (Q2-‘23): 10,301
Units Added Since Q2-‘22: +0
Asking Rent Growth Since Q2-‘22: 4.4%
Asking Rent (Q2-‘23): $1,295
Effective Rent (Q2-‘23): $1,285
Multifamily Vacancy Rate (Q2-‘23): 4.4%
Multifamily Cap Rate (Q2-‘23): 6.9%
Source: National Association of Realtors
Hagerstown, MD Housing Market Statistics:
Median Home Price (Q2-‘23): $293,200
Home Price Appreciation Since Q2-‘22: 4.8%
Source: National Association of Realtors
Lists That Mention Hagerstown, MD:
Emerging Housing Markets Index – Fall 2023 (WSJ/Realtor.com): #164
#32: Champaign-Urbana, IL
Champaign-Urbana, IL Metro Area Population: 223,265
Champaign-Urbana, IL Rental Market Statistics:
Rental Inventory (Q2-‘23): 16,272
Units Added Since Q2-‘22: +0
Asking Rent Growth Since Q2-‘22: 4.3%
Asking Rent (Q2-‘23): $1,034
Effective Rent (Q2-‘23): $1,029
Multifamily Vacancy Rate (Q2-‘23): 5.8%
Multifamily Cap Rate (Q2-‘23): 7.1%
Source: National Association of Realtors
Champaign-Urbana, IL Housing Market Statistics:
Median Home Price (Q2-‘23): $211,900
Home Price Appreciation Since Q2-‘22: 3.7%
Source: National Association of Realtors
Lists That Mention Champaign-Urbana, IL:
Emerging Housing Markets Index – Fall 2023 (WSJ/Realtor.com): #79
#33: Oshkosh, WI
Oshkosh-Neenah, WI Metro Area Population: 170,718
Oshkosh, WI Rental Market Statistics:
Rental Inventory (Q2-‘23): 10,642
Units Added Since Q2-‘22: +207
Asking Rent Growth Since Q2-‘22: 4.4%
Asking Rent (Q2-‘23): $927
Effective Rent (Q2-‘23): $922
Multifamily Vacancy Rate (Q2-‘23): 4.6%
Multifamily Cap Rate (Q2-‘23): 7.2%
Source: National Association of Realtors
Oshkosh, WI Housing Market Statistics:
Median Home Price (Q2-‘23): $251,400
Home Price Appreciation Since Q2-‘22: 9.4%
Source: National Association of Realtors
Lists That Mention Oshkosh, WI:
Emerging Housing Markets Index – Fall 2023 (WSJ/Realtor.com): #3
#34: Cumberland, MD
Cumberland, MD-WV Metro Area Population: 94,122
Cumberland, MD Rental Market Statistics:
Rental Inventory (Q2-‘23): 929
Units Added Since Q2-‘22: +0
Asking Rent Growth Since Q2-‘22: 1.1%
Asking Rent (Q2-‘23): $764
Effective Rent (Q2-‘23): $760
Multifamily Vacancy Rate (Q2-‘23): 3.2%
Multifamily Cap Rate (Q2-‘23): 7.2%
Source: National Association of Realtors
Cumberland, MD Housing Market Statistics:
Median Home Price (Q2-‘23): $145,400
Home Price Appreciation Since Q2-‘22: 4.6%
Source: National Association of Realtors
#35: Appleton, WI
Appleton, WI Metro Area Population: 244,845
Appleton, WI Rental Market Statistics:
Rental Inventory (Q2-‘23): 12,265
Units Added Since Q2-‘22: +66
Asking Rent Growth Since Q2-‘22: 4.7%
Asking Rent (Q2-‘23): $1,068
Effective Rent (Q2-‘23): $1,065
Multifamily Vacancy Rate (Q2-‘23): 1.5%
Multifamily Cap Rate (Q2-‘23): 7.0%
Source: National Association of Realtors
Appleton, WI Housing Market Statistics:
Median Home Price (Q2-‘23): $284,700
Home Price Appreciation Since Q2-‘22: 3.1%
Source: National Association of Realtors
Lists That Mention Appleton, WI:
Emerging Housing Markets Index – Fall 2023 (WSJ/Realtor.com): #44
#36: Omaha, NE
Omaha-Council Bluffs, NE-IA Metro Area Population: 976,875
Omaha, NE Rental Market Statistics:
Rental Inventory (Q2-‘23): 80,795
Units Added Since Q2-‘22: +1,057
Asking Rent Growth Since Q2-‘22: 5.1%
Asking Rent (Q2-‘23): $1,147
Effective Rent (Q2-‘23): $1,141
Multifamily Vacancy Rate (Q2-‘23): 6.0%
Multifamily Cap Rate (Q2-‘23): 6.4%
Source: National Association of Realtors
Omaha, NE Housing Market Statistics:
Median Home Price (Q2-‘23): $297,500
Home Price Appreciation Since Q2-‘22: 5.8%
Source: National Association of Realtors
Lists That Mention Omaha, NE:
Markets to Watch – Overall Real Estate Prospects 2024 (PwC/ULI): #64
Emerging Housing Markets Index – Fall 2023 (WSJ/Realtor.com): #173
Best Places to Live – 2023-2024 (U.S. News): #46
#37: Columbus, OH
Columbus, OH Metro Area Population: 2,161,511
Columbus, OH Rental Market Statistics:
Rental Inventory (Q2-‘23): 208,825
Units Added Since Q2-‘22: +2,669
Asking Rent Growth Since Q2-‘22: 3.7%
Asking Rent (Q2-‘23): $1,252
Effective Rent (Q2-‘23): $1,241
Multifamily Vacancy Rate (Q2-‘23): 7.4%
Multifamily Cap Rate (Q2-‘23): 6.2%
Source: National Association of Realtors
Columbus, OH Housing Market Statistics:
Median Home Price (Q2-‘23): $327,500
Home Price Appreciation Since Q2-‘22: 1.6%
Source: National Association of Realtors
Lists That Mention Columbus, OH:
Markets to Watch – Overall Real Estate Prospects 2024 (PwC/ULI): #53
Emerging Housing Markets Index – Fall 2023 (WSJ/Realtor.com): #9
Best Places to Live – 2023-2024 (U.S. News): #69
Top-Rated Cities for Multifamily Investment 2024 (PwC/ULI): #3
#38: Oklahoma City, OK
Oklahoma City, OK Metro Area Population: 1,459,380
Oklahoma City, OK Rental Market Statistics:
Rental Inventory (Q2-‘23): 96,145
Units Added Since Q2-‘22: -314
Asking Rent Growth Since Q2-‘22: 1.5%
Asking Rent (Q2-‘23): $942
Effective Rent (Q2-‘23): $932
Multifamily Vacancy Rate (Q2-‘23): 9.9%
Multifamily Cap Rate (Q2-‘23): 6.7%
Source: National Association of Realtors
Oklahoma City, OK Housing Market Statistics:
Median Home Price (Q2-‘23): $247,600
Home Price Appreciation Since Q2-‘22: 6.8%
Source: National Association of Realtors
Lists That Mention Oklahoma City, OK:
Markets to Watch – Overall Real Estate Prospects 2024 (PwC/ULI): #65
Emerging Housing Markets Index – Fall 2023 (WSJ/Realtor.com): #241
Best Places to Live – 2023-2024 (U.S. News): #106
Top-Rated Cities for Multifamily Investment 2024 (PwC/ULI): #10
#39: Hartford, CT
Hartford-East Hartford-Middletown, CT Metro Area Population: 1,221,303
Hartford, CT Rental Market Statistics:
Rental Inventory (Q2-‘23): 65,828
Units Added Since Q2-‘22: +111
Asking Rent Growth Since Q2-‘22: 4.4%
Asking Rent (Q2-‘23): $1,570
Effective Rent (Q2-‘23): $1,560
Multifamily Vacancy Rate (Q2-‘23): 4.5%
Multifamily Cap Rate (Q2-‘23): 6.4%
Source: National Association of Realtors
Hartford, CT Housing Market Statistics:
Median Home Price (Q2-‘23): $357,800
Home Price Appreciation Since Q2-‘22: 6.0%
Source: National Association of Realtors
Lists That Mention Hartford, CT:
Markets to Watch – Overall Real Estate Prospects 2024 (PwC/ULI): #80
Emerging Housing Markets Index – Fall 2023 (WSJ/Realtor.com): #19
Best Places to Live – 2023-2024 (U.S. News): #56
#40: Winston-Salem, NC
Winston-Salem, NC Metro Area Population: 688,471
Winston-Salem, NC Rental Market Statistics:
Rental Inventory (Q2-‘23): 33,071
Units Added Since Q2-‘22: +0
Asking Rent Growth Since Q2-‘22: 1.7%
Asking Rent (Q2-‘23): $1,145
Effective Rent (Q2-‘23): $1,134
Multifamily Vacancy Rate (Q2-‘23): 8.5%
Multifamily Cap Rate (Q2-‘23): 5.7%
Source: National Association of Realtors
Winston-Salem, NC Housing Market Statistics:
Median Home Price (Q2-‘23): $292,200
Home Price Appreciation Since Q2-‘22: 0.8%
Source: National Association of Realtors
Lists That Mention Winston-Salem, NC:
Emerging Housing Markets Index – Fall 2023 (WSJ/Realtor.com): #92
Best Places to Live – 2023-2024 (U.S. News): #41
#41: Harrisburg, PA
Harrisburg-Carlisle, PA Metro Area Population: 603,493
Harrisburg, PA Rental Market Statistics:
Rental Inventory (Q2-‘23): 31,316
Units Added Since Q2-‘22: +368
Asking Rent Growth Since Q2-‘22: 2.0%
Asking Rent (Q2-‘23): $1,288
Effective Rent (Q2-‘23): $1,282
Multifamily Vacancy Rate (Q2-‘23): 5.1%
Multifamily Cap Rate (Q2-‘23): 6.0%
Source: National Association of Realtors
Harrisburg, PA Housing Market Statistics:
Median Home Price (Q2-‘23): $250,700
Home Price Appreciation Since Q2-‘22: 0%
Source: National Association of Realtors
Lists That Mention Harrisburg, PA:
Emerging Housing Markets Index – Fall 2023 (WSJ/Realtor.com): #63
Best Places to Live – 2023-2024 (U.S. News): #38
#42: Reading, PA
Reading, PA Metro Area Population: 430,449
Reading, PA Rental Market Statistics:
Rental Inventory (Q2-‘23): 9,691
Units Added Since Q2-‘22: +20
Asking Rent Growth Since Q2-‘22: 3.2%
Asking Rent (Q2-‘23): $1,312
Effective Rent (Q2-‘23): $1,308
Multifamily Vacancy Rate (Q2-‘23): 2.3%
Multifamily Cap Rate (Q2-‘23): 6.8%
Source: National Association of Realtors
Reading, PA Housing Market Statistics:
Median Home Price (Q2-‘23): $267,500
Home Price Appreciation Since Q2-‘22: 10.1%
Source: National Association of Realtors
Lists That Mention Reading, PA:
Emerging Housing Markets Index – Fall 2023 (WSJ/Realtor.com): #57
Best Places to Live – 2023-2024 (U.S. News): #88
#43: Burlington, VT
Burlington-South Burlington, VT Metro Area Population: 228,270
Burlington, VT Rental Market Statistics:
Rental Inventory (Q2-‘23): 6,473
Units Added Since Q2-‘22: +49
Asking Rent Growth Since Q2-‘22: 5.3%
Asking Rent (Q2-‘23): $1,751
Effective Rent (Q2-‘23): $1,745
Multifamily Vacancy Rate (Q2-‘23): 1.7%
Multifamily Cap Rate (Q2-‘23): 6.9%
Source: National Association of Realtors
Burlington, VT Housing Market Statistics:
Median Home Price (Q2-‘23): $486,500
Home Price Appreciation Since Q2-‘22: 5.1%
Source: National Association of Realtors
Lists That Mention Burlington, VT:
Emerging Housing Markets Index – Fall 2023 (WSJ/Realtor.com): #28
#44: Wichita Falls, TX
Wichita Falls, TX Metro Area Population: 149,299
Wichita Falls, TX Rental Market Statistics:
Rental Inventory (Q2-‘23): 6,287
Units Added Since Q2-‘22: +0
Asking Rent Growth Since Q2-‘22: 5.1%
Asking Rent (Q2-‘23): $848
Effective Rent (Q2-‘23): $844
Multifamily Vacancy Rate (Q2-‘23): 8.9%
Multifamily Cap Rate (Q2-‘23): 7.2%
Source: National Association of Realtors
Wichita Falls, TX Housing Market Statistics:
Median Home Price (Q2-‘23): $193,300
Home Price Appreciation Since Q2-‘22: 11.1%
Source: National Association of Realtors
Lists That Mention Wichita Falls, TX:
Emerging Housing Markets Index – Fall 2023 (WSJ/Realtor.com): #118
#45: Pittsfield, MA
Pittsfield, MA Metro Area Population: 127,859
Pittsfield, MA Rental Market Statistics:
Rental Inventory (Q2-‘23): 2,006
Units Added Since Q2-‘22: +0
Asking Rent Growth Since Q2-‘22: 5.1%
Asking Rent (Q2-‘23): $1,169
Effective Rent (Q2-‘23): $1,164
Multifamily Vacancy Rate (Q2-‘23): 3.4%
Multifamily Cap Rate (Q2-‘23): 7.6%
Source: National Association of Realtors
Pittsfield, MA Housing Market Statistics:
Median Home Price (Q2-‘23): $287,400
Home Price Appreciation Since Q2-‘22: -11.3%
Source: National Association of Realtors
Lists That Mention Pittsfield, MA:
Emerging Housing Markets Index – Fall 2023 (WSJ/Realtor.com): #127
#46: Lansing, MI
Lansing-East Lansing, MI Metro Area Population: 540,870
Lansing, MI Rental Market Statistics:
Rental Inventory (Q2-‘23): 31,746
Units Added Since Q2-‘22: +218
Asking Rent Growth Since Q2-‘22: 4.8%
Asking Rent (Q2-‘23): $1,117
Effective Rent (Q2-‘23): $1,111
Multifamily Vacancy Rate (Q2-‘23): 7.1%
Multifamily Cap Rate (Q2-‘23): 6.6%
Source: National Association of Realtors
Lansing, MI Housing Market Statistics:
Median Home Price (Q2-‘23): $226,100
Home Price Appreciation Since Q2-‘22: 4.5%
Source: National Association of Realtors
Lists That Mention Lansing, MI:
Emerging Housing Markets Index – Fall 2023 (WSJ/Realtor.com): #42
Best Places to Live – 2023-2024 (U.S. News): #83
#47: Lexington, KY
Lexington-Fayette, KY Metro Area Population: 517,916
Lexington, KY Rental Market Statistics:
Rental Inventory (Q2-‘23): 38,330
Units Added Since Q2-‘22: +202
Asking Rent Growth Since Q2-‘22: 4.8%
Asking Rent (Q2-‘23): $1,107
Effective Rent (Q2-‘23): $1,100
Multifamily Vacancy Rate (Q2-‘23): 6.6%
Multifamily Cap Rate (Q2-‘23): 6.2%
Source: National Association of Realtors
Lexington, KY Housing Market Statistics:
Median Home Price (Q2-‘23): $261,300
Home Price Appreciation Since Q2-‘22: 4.1%
Source: National Association of Realtors
Lists That Mention Lexington, KY:
Markets to Watch – Overall Real Estate Prospects 2024 (PwC/ULI): #42
Emerging Housing Markets Index – Fall 2023 (WSJ/Realtor.com): #213
Best Places to Live – 2023-2024 (U.S. News): #34
#48: Montgomery, AL
Montgomery, AL Metro Area Population: 388,243
Montgomery, AL Rental Market Statistics:
Rental Inventory (Q2-‘23): 20,570
Units Added Since Q2-‘22: +0
Asking Rent Growth Since Q2-‘22: 2.1%
Asking Rent (Q2-‘23): $977
Effective Rent (Q2-‘23): $972
Multifamily Vacancy Rate (Q2-‘23): 10.6%
Multifamily Cap Rate (Q2-‘23): 6.6%
Source: National Association of Realtors
Montgomery, AL Housing Market Statistics:
Median Home Price (Q2-‘23): $214,200
Home Price Appreciation Since Q2-‘22: 2.9%
Source: National Association of Realtors
Lists That Mention Montgomery, AL:
Emerging Housing Markets Index – Fall 2023 (WSJ/Realtor.com): #139
Best Places to Live – 2023-2024 (U.S. News): #94
#49: Erie, PA
Erie, PA Metro Area Population: 267,689
Erie, PA Rental Market Statistics:
Rental Inventory (Q2-‘23): 6,575
Units Added Since Q2-‘22: +0
Asking Rent Growth Since Q2-‘22: 5.0%
Asking Rent (Q2-‘23): $1,050
Effective Rent (Q2-‘23): $1,047
Multifamily Vacancy Rate (Q2-‘23): 2.2%
Multifamily Cap Rate (Q2-‘23): 7.8%
Source: National Association of Realtors
Erie, PA Housing Market Statistics:
Median Home Price (Q2-‘23): $169,000
Home Price Appreciation Since Q2-‘22: 5.8%
Source: National Association of Realtors
Lists That Mention Erie, PA:
Emerging Housing Markets Index – Fall 2023 (WSJ/Realtor.com): #81
#50: York, PA
York-Hanover, PA Metro Area Population: 461,058
York, PA Rental Market Statistics:
Rental Inventory (Q2-‘23): 11,498
Units Added Since Q2-‘22: +461
Asking Rent Growth Since Q2-‘22: 3.2%
Asking Rent (Q2-‘23): $1,405
Effective Rent (Q2-‘23): $1,398
Multifamily Vacancy Rate (Q2-‘23): 6.5%
Multifamily Cap Rate (Q2-‘23): 6.5%
Source: National Association of Realtors
York, PA Housing Market Statistics:
Median Home Price (Q2-‘23): $265,800
Home Price Appreciation Since Q2-‘22: 6.9%
Source: National Association of Realtors
Lists That Mention York, PA:
Emerging Housing Markets Index – Fall 2023 (WSJ/Realtor.com): #130
Best Places to Live – 2023-2024 (U.S. News): #78
#51: Grand Rapids, MI
Grand Rapids-Kentwood, MI Metro Area Population: 1,094,198
Grand Rapids, MI Rental Market Statistics:
Rental Inventory (Q2-‘23): 51,161
Units Added Since Q2-‘22: +72
Asking Rent Growth Since Q2-‘22: 3.3%
Asking Rent (Q2-‘23): $1,353
Effective Rent (Q2-‘23): $1,347
Multifamily Vacancy Rate (Q2-‘23): 4.7%
Multifamily Cap Rate (Q2-‘23): 5.8%
Source: National Association of Realtors
Grand Rapids, MI Housing Market Statistics:
Median Home Price (Q2-‘23): $330,300
Home Price Appreciation Since Q2-‘22: 4.8%
Source: National Association of Realtors
Lists That Mention Grand Rapids, MI:
Emerging Housing Markets Index – Fall 2023 (WSJ/Realtor.com): #68
Best Places to Live – 2023-2024 (U.S. News): #20
#52: Springfield, MA
Springfield, MA Metro Area Population: 694,523
Springfield, MA Rental Market Statistics:
Rental Inventory (Q2-‘23): 23,436
Units Added Since Q2-‘22: +90
Asking Rent Growth Since Q2-‘22: 4.4%
Asking Rent (Q2-‘23): $1,365
Effective Rent (Q2-‘23): $1,361
Multifamily Vacancy Rate (Q2-‘23): 2.6%
Multifamily Cap Rate (Q2-‘23): 7.3%
Source: National Association of Realtors
Springfield, MA Housing Market Statistics:
Median Home Price (Q2-‘23): $336,000
Home Price Appreciation Since Q2-‘22: 0.4%
Source: National Association of Realtors
Lists That Mention Springfield, MA:
Emerging Housing Markets Index – Fall 2023 (WSJ/Realtor.com): #25
Best Places to Live – 2023-2024 (U.S. News): #108
#53: Norwich, CT
Norwich-New London, CT Metro Area Population: 269,902
Norwich, CT Rental Market Statistics:
Rental Inventory (Q2-‘23): 10,761
Units Added Since Q2-‘22: +50
Asking Rent Growth Since Q2-‘22: 3.3%
Asking Rent (Q2-‘23): $1,542
Effective Rent (Q2-‘23): $1,536
Multifamily Vacancy Rate (Q2-‘23): 4.4%
Multifamily Cap Rate (Q2-‘23): 6.3%
Source: National Association of Realtors
Norwich, CT Housing Market Statistics:
Median Home Price (Q2-‘23): $345,900
Home Price Appreciation Since Q2-‘22: 3.9%
Source: National Association of Realtors
Lists That Mention Norwich, CT:
Emerging Housing Markets Index – Fall 2023 (WSJ/Realtor.com): #27
#54: Topeka, KS
Topeka, KS Metro Area Population: 231,783
Topeka, KS Rental Market Statistics:
Rental Inventory (Q2-‘23): 9,689
Units Added Since Q2-‘22: +0
Asking Rent Growth Since Q2-‘22: 3.9%
Asking Rent (Q2-‘23): $838
Effective Rent (Q2-‘23): $834
Multifamily Vacancy Rate (Q2-‘23): 9.1%
Multifamily Cap Rate (Q2-‘23): 7.6%
Source: National Association of Realtors
Topeka, KS Housing Market Statistics:
Median Home Price (Q2-‘23): $194,600
Home Price Appreciation Since Q2-‘22: 2.6%
Source: National Association of Realtors
Lists That Mention Topeka, KS:
Emerging Housing Markets Index – Fall 2023 (WSJ/Realtor.com): #1
#55: Indianapolis, IN
Indianapolis-Carmel-Anderson, IN Metro Area Population: 2,142,193
Indianapolis, IN Rental Market Statistics:
Rental Inventory (Q2-‘23): 162,903
Units Added Since Q2-‘22: +1,078
Asking Rent Growth Since Q2-‘22: 3.6%
Asking Rent (Q2-‘23): $1,217
Effective Rent (Q2-‘23): $1,207
Multifamily Vacancy Rate (Q2-‘23): 8.4%
Multifamily Cap Rate (Q2-‘23): 5.9%
Source: National Association of Realtors
Indianapolis, IN Housing Market Statistics:
Median Home Price (Q2-‘23): $311,200
Home Price Appreciation Since Q2-‘22: 2.6%
Source: National Association of Realtors
Lists That Mention Indianapolis, IN:
Markets to Watch – Overall Real Estate Prospects 2024 (PwC/ULI): #22
Emerging Housing Markets Index – Fall 2023 (WSJ/Realtor.com): #98
Best Places to Live – 2023-2024 (U.S. News): #68
#56: Des Moines, IA
Des Moines-West Des Moines, IA Metro Area Population: 729,053
Des Moines, IA Rental Market Statistics:
Rental Inventory (Q2-‘23): 56,888
Units Added Since Q2-‘22: +192
Asking Rent Growth Since Q2-‘22: 3.5%
Asking Rent (Q2-‘23): $1,105
Effective Rent (Q2-‘23): $1,097
Multifamily Vacancy Rate (Q2-‘23): 6.5%
Multifamily Cap Rate (Q2-‘23): 7.1%
Source: National Association of Realtors
Des Moines, IA Housing Market Statistics:
Median Home Price (Q2-‘23): $296,600
Home Price Appreciation Since Q2-‘22: 3.0%
Source: National Association of Realtors
Lists That Mention Des Moines, IA:
Markets to Watch – Overall Real Estate Prospects 2024 (PwC/ULI): #69
Emerging Housing Markets Index – Fall 2023 (WSJ/Realtor.com): #287
Best Places to Live – 2023-2024 (U.S. News): #19
#57: Spartanburg, SC
Spartanburg, SC Metro Area Population: 345,831
Spartanburg, SC Rental Market Statistics:
Rental Inventory (Q2-‘23): 14,776
Units Added Since Q2-‘22: +132
Asking Rent Growth Since Q2-‘22: 3.9%
Asking Rent (Q2-‘23): $1,220
Effective Rent (Q2-‘23): $1,204
Multifamily Vacancy Rate (Q2-‘23): 16.6%
Multifamily Cap Rate (Q2-‘23): 5.1%
Source: National Association of Realtors
Spartanburg, SC Housing Market Statistics:
Median Home Price (Q2-‘23): $291,100
Home Price Appreciation Since Q2-‘22: 5.5%
Source: National Association of Realtors
Lists That Mention Spartanburg, SC:
Emerging Housing Markets Index – Fall 2023 (WSJ/Realtor.com): #199
Best Places to Live – 2023-2024 (U.S. News): #43
Fastest-Growing Real Estate Markets – 2023-2024 (U.S. News): #12
#58: Springfield, IL
Springfield, IL Metro Area Population: 205,513
Springfield, IL Rental Market Statistics:
Rental Inventory (Q2-‘23): 7,312
Units Added Since Q2-‘22: +0
Asking Rent Growth Since Q2-‘22: 6.9%
Asking Rent (Q2-‘23): $893
Effective Rent (Q2-‘23): $890
Multifamily Vacancy Rate (Q2-‘23): 8.0%
Multifamily Cap Rate (Q2-‘23): 7.2%
Source: National Association of Realtors
Springfield, IL Housing Market Statistics:
Median Home Price (Q2-‘23): $162,600
Home Price Appreciation Since Q2-‘22: 5.0%
Source: National Association of Realtors
Lists That Mention Springfield, IL:
Emerging Housing Markets Index – Fall 2023 (WSJ/Realtor.com): #40
#59: Florence, SC
Florence, SC Metro Area Population: 199,119
Florence, SC Rental Market Statistics:
Rental Inventory (Q2-‘23): 5,548
Units Added Since Q2-‘22: +0
Asking Rent Growth Since Q2-‘22: 8.0%
Asking Rent (Q2-‘23): $1,079
Effective Rent (Q2-‘23): $1,074
Multifamily Vacancy Rate (Q2-‘23): 6.8%
Multifamily Cap Rate (Q2-‘23): 6.5%
Source: National Association of Realtors
Florence, SC Housing Market Statistics:
Median Home Price (Q2-‘23): $208,200
Home Price Appreciation Since Q2-‘22: 1.6%
Source: National Association of Realtors
Lists That Mention Florence, SC:
Emerging Housing Markets Index – Fall 2023 (WSJ/Realtor.com): #160
#60: Bismarck, ND
Bismarck, ND Metro Area Population: 134,427
Bismarck, ND Rental Market Statistics:
Rental Inventory (Q2-‘23): 6,679
Units Added Since Q2-‘22: +0
Asking Rent Growth Since Q2-‘22: 5.1%
Asking Rent (Q2-‘23): $1,070
Effective Rent (Q2-‘23): $1,067
Multifamily Vacancy Rate (Q2-‘23): 4.7%
Multifamily Cap Rate (Q2-‘23): 8.6%
Source: National Association of Realtors
Bismarck, ND Housing Market Statistics:
Median Home Price (Q2-‘23): $277,400
Home Price Appreciation Since Q2-‘22: -3.0%
Source: National Association of Realtors
Lists That Mention Bismarck, ND:
Emerging Housing Markets Index – Fall 2023 (WSJ/Realtor.com): #190
Methodology: How Do We Calculate Our Rankings of Up-and-Coming Real Estate Markets?
Industry Indicators
Measures of opportunity for rental property investors and property managers:
- Markets with the best overall real estate investment prospects, as measured by PwC and the Urban Land Institute
- Markets with the best multifamily investment prospects, as measured by PwC and the Urban Land Institute
- Housing markets with emerging investment opportunities, as measured by the Wall Street Journal and Realtor.com
- Markets with a greater number of renters relative to homeowners, as measured by the National Association of Realtors
- Markets with a high rate of renter household formation, as measured by the National Association of Realtors
Housing Indicators
Measures of property prices and rent growth:
- Markets with the highest growth in asking rents, as measured by the National Association of Realtors
- Markets with the lowest rental property vacancy rate, as measured by the National Association of Realtors
- Markets with the highest rental property cap rates, as measured by the National Association of Realtors
- Markets with the most home price appreciation, as measured by the National Association of Realtors
- Markets with affordable home prices relative to income, as measured by the National Association of Realtors
- Markets with affordable monthly mortgage payments relative to income, as measured by the National Association of Realtors
- Markets that present the best value for residents, as measured by U.S. News
Economic and Job Market Indicators
Measures of employment growth:
- Markets with the lowest unemployment rates, as measured by the National Association of Realtors
- Markets with the most employment growth, as measured by the National Association of Realtors
- Markets with the most GDP growth, as measured by the National Association of Realtors
- Cities with the strongest job markets, as measured by U.S. News
- States with the most economic activity, as measured by the National Association of Realtors
- Markets with a high rate of inbound business moves relative to outbound moves, as measured by the National Association of Realtors
Demographic Indicators
Measures of population growth:
- Markets with the greatest population growth, as measured by the National Association of Realtors
- The fastest-growing real estate markets, as measured by U.S. News
- Markets with a high rate of inbound moves relative to outbound moves, as measured by the National Association of Realtors
- The best places to live, based on analyses of quality of life and desirability, as measured by U.S. News