

The Science of Growing Your Portfolio
Learn the steps to get your property management company's portfolio growth down to a science.
Get the GuideYou run your business on more than instinct, and property management KPIs give you the numbers behind the calls you make every day. Track the right handful and you always know how your company is performing, where it is slipping, and where it is ready to grow.
This post walks through 11 property management KPIs worth following, what a healthy number looks like, and how to act on what you see.
What We’ll Cover:
- The revenue, profitability, and cost KPIs that show a property management company’s true financial health
- Occupancy, leasing, and collection metrics that keep cash flowing
- Retention and maintenance signals that protect property management margins
Why Property Management KPIs Matter
KPIs help you measure the same numbers month after month. You can see how you stack up against your own past performance and against other companies in your market. That gives you an honest read on the health of your business and a way to spot small problems before they become expensive ones.
The property managers who grow are the ones who know their numbers and act on them.
11 Property Management KPIs to Track: A Quick Overview
| KPI | What It Measures |
|---|---|
| Revenue Growth | Percentage change in total income period over period |
| Properties Won vs. Lost | Net change in your client portfolio |
| Net Operating Income (NOI) | Operating income minus operating expenses |
| Property Acquisition Cost | Cost to win each new unit |
| Occupancy and Vacancy Rates | How well you fill and hold units |
| Rent Collection Rate | Percentage of rent collected on time |
| Tenant Turnover Rate | How often residents move out |
| Rent-Ready Costs | Full cost to prepare a unit for the next resident |
| Average Days-to-Lease | Time from vacancy to signed lease |
| Property Management Fees | Your pricing relative to market and service level |
| Repair and Maintenance Costs | Total spend on upkeep and response time |
#1: Revenue Growth
Revenue growth belongs at the top of every property manager’s list. It measures the percentage change in your total income from one period to the next, and it tells you at a glance whether your company is moving in the right direction.
Watch this number over time across several months, not a single one. A strong quarter can hide a slow one, and a slow month can mask steady progress. When revenue moves up or down, the other KPIs in this post explain why. Treat revenue growth as the headline and the rest of your metrics as the story behind it.
#2: Properties Won vs. Properties Lost
Track the properties you win and the ones you lose on the same scorecard. Winning new doors is only half the picture. If you are adding units at the front door while losing them out the back, your real growth is slower than it looks.
Some client turnover is normal. NARPM data puts average annual client churn at 19.5 percent, with top-performing companies holding it to 9.6 percent, so a few departures do not mean something is broken. What matters is the trend and the reason behind each loss. Follow up with every client who leaves and ask what drove the decision. The answers point you toward the fixes that keep the next client from walking.
Taking on doors that do not fit your operation can cost you more in service headaches than they add in fees, so chase the right clients, not raw volume.
#3: Net Operating Income (NOI) and Net Income
Where revenue tells you how much money comes in, net operating income tells you how much of that you actually keep. NOI is your operating income minus your operating expenses, and it is the clearest read on whether your properties are actually profitable.
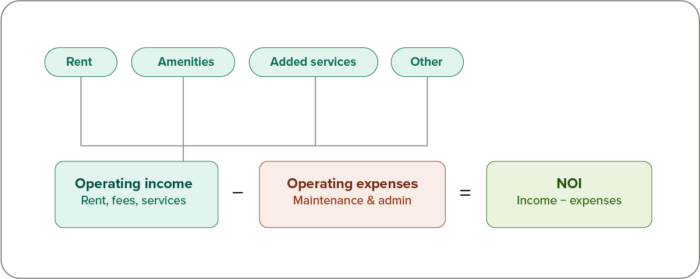
Look at every income stream that feeds the number. Rent, amenity fees, added services, and other offerings all contribute to the income side of the equation. Many property managers are building new revenue services into their portfolios to grow the income side. When you know which streams carry your profitability, you know where to invest and where to trim.
#4: Property Acquisition Cost
Property acquisition cost tells you how efficiently you win new business. Divide your total sales and marketing budget by the number of new units you acquired in the same period.
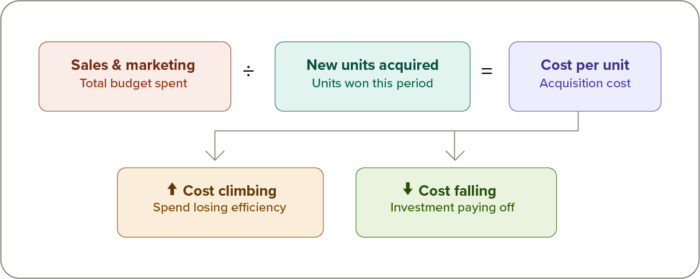
Track it over time. If the cost per unit climbs while your close rate holds steady, your business development spending is losing efficiency and deserves a closer look. If it drops, whatever you changed is working, and you can put more behind it.
#5: Occupancy and Vacancy Rates
Your occupancy rate shows how well you are filling and holding units, and your vacancy rate is the flip side of the same coin. The U.S. Census Bureau puts the national rental vacancy rate at 7.3 percent, which means roughly 93 percent of rental units are occupied, though the right target depends on your market.
Compare your rate to the market average before you judge it. Occupancy that sits well above the market can be a signal that your rent is priced too low and you are leaving money on the table. Longer vacancies have become a bigger challenge across the industry, so watch how long units sit empty as closely as you watch the rate itself.
The goal is finding and keeping the right residents. Strong occupancy built on good resident matches holds up far better than a high number built on quick placements that do not last.
#6: Rent Collection Rate and Average Arrears
Your rent collection rate is the percentage of rent you collect on time, and it is one of the fastest reads on your cash flow. Average arrears—the money owed to you that has not come in yet—is the other half of the story.
Watch both together. A single late payment is not a pattern, but residents who are consistently late, say seven or more days past the due date, drag down your collection rate and tie up cash you need to run the business. Online payment analytics tools make this easy to see, showing you who paid in full and who is falling behind so you can act early and avoid chasing balances at month end.
#7: Tenant Turnover Rate
Tenant turnover measures how often residents move out, and it carries real cost every time it happens. Research the typical ranges in your area to see where you stand.
In many cases, turnover that runs above average is a signal of overdue maintenance, missing amenities, slow responses to requests, or pricing that is out of step with the value you deliver. Ask departing residents why they are leaving. Their answers are the cheapest market research you will ever get, and they tell you exactly what to fix before the next resident reaches the same conclusion. You can even use dedicated tools such as Opiniion to make gathering feedback quick and unobtrusive.
#8: Rent-Ready Costs
Rent-ready costs are the full price of getting a unit ready for the next resident, and they are easy to underestimate. Count everything, from the cost of materials and vendor charges to the labor hours your team spends on the turn.
Track this number across your portfolio. Once you know what a typical turn really costs, you can spot the units and vendors that run high and find where your process can get more efficient. The property managers who watch rent-ready costs closely are the ones who keep turnover from quietly eating their margins.
#9: Average Days-to-Lease
Average days-to-lease measures how long a unit sits before you sign a new resident. Every day empty is revenue you do not capture, which makes this one of the more important speed metrics to watch.
Compare your number to the market. In hot markets, units often lease in under two weeks. If yours take longer, review your listing channels and your lead-to-lease process to find the holdup. Just do not win speed by underpricing the unit, because a fast lease at the wrong rent costs you every month of the term.
Reliable leasing software helps you list widely, respond to leads fast, and move applicants through without the back-and-forth that slows everyone down.
#10: Property Management Fees to Owners
Your management fees are a direct read on your pricing health. Most property managers charge a percentage of a property’s monthly revenue, with the exact figure tied to the level of service you deliver.
Benchmark your fees against other companies in your market. If you sit at the bottom of the range, you may be underselling the value you give owners, and there is room to price closer to what your service is worth. Resist the urge to under-discount just to win a deal. As you add services and take on more for your clients, your fee structure should reflect the added value you bring.
#11: Repair and Maintenance Costs
Repair and maintenance is often your largest expense line, which makes it the place where savings hide. Do not rubber-stamp every repair that crosses your desk. Compare vendor pricing, question estimates that look high, and benchmark project costs so you know a fair price when you see one.
Track maintenance response time alongside the dollars. How fast you close out a request shapes resident satisfaction and retention, and slow responses show up later as turnover in KPI number seven. When you watch both cost and speed, you keep your biggest expense under control without letting service slip.
How to Track Property Management KPIs in Buildium Easily
Buildium’s built-in analytics and insights features, shows real-time performance across your business in one place. You can track revenue, leasing, and portfolio metrics, then set goals against localized industry benchmarks and competitors. The platform’s clear visualization of the data that matters makes it easier to know what to focus on and share important details with staff and clients.
Because Buildium regularly records everything from property management accounting and rent payments to maintenance work, your numbers are always up to date.
Turn Your KPIs into a Data-Driven Property Management Business
The property managers who grow with confidence are the ones who know their numbers cold. You do not need to track everything at once. Start with a few of these KPIs, build the habit of reviewing them on a set schedule, and let the data guide where you spend your time and money.
Key Takeaways:
- Revenue growth and NOI show your topline and true profitability; read them together.
- Occupancy, rent collection rate, and days-to-lease keep your cash flowing.
- Tenant turnover, rent-ready costs, and maintenance response time protect your margins.
- Benchmark every number against your own history and your local market before you act.
Pulling all of these numbers by hand gets old fast, and that is where the right software earns its keep. If you want to see these KPIs in one place without the spreadsheet gymnastics, you can give Buildium a try with a 14-day free trial or sign up for a guided demo to walk through the reporting with a product specialist.
Frequently Asked Questions
What are property management KPIs?
Property management KPIs, or key performance indicators, are the numbers you track to measure the health and performance of your property management business. They cover everything from revenue and profitability to occupancy, rent collection, tenant turnover, and maintenance costs.
Why should property managers track KPIs?
Tracking KPIs turns gut feel into decisions you can defend. The numbers show you how your business is performing over time, let you benchmark against your market, and help you catch small problems before they turn into expensive ones.
Which KPIs are important for property managers to track?
Start with revenue growth, net operating income (NOI), and rent collection rate for a read on financial health, then add occupancy and vacancy rates, tenant turnover, average days-to-lease, and repair and maintenance costs. Together these give you a full picture of where your business stands and where it can improve.
How can tracking occupancy rates benefit property managers?
Occupancy rates show how well you are filling and holding units. Comparing your rate to the market average tells you whether you are keeping pace, and it can even flag when your rent is priced too low relative to demand.
What is the significance of tenant turnover rate?
Tenant turnover rate shows how often residents move out, and every move-out carries cost. A rate that runs above the market average usually points to a fixable problem, such as overdue maintenance or slow responses, so it is one of the most useful signals for protecting your margins.
How do maintenance KPIs impact property management?
Maintenance is often your biggest expense, so tracking both cost and response time helps you protect profitability and resident satisfaction at once. Watching these numbers helps you spot overpriced work and slow turnarounds before they show up as higher turnover.
Read more on Growth