
For the last four years, the same trend has been embodied by our list of up-and-coming real estate markets: High levels of apartment construction concentrated in Sun Belt markets like Dallas, Austin, Phoenix, and Atlanta—in addition to primary markets like New York City—have driven down rent growth and cap rates in these popular metros.
As a result, growth has emerged in areas that have received less attention from institutional investors and developers: namely, the Midwest, Mid-Atlantic, South Central, and New England regions.
This is a trend that’s been remarkably consistent over time: 41 of the 60 up-and-coming real estate markets we identified last year have remained on the list this year, with states like Ohio and Wisconsin in the Midwest, and Pennsylvania in the Mid-Atlantic, appearing at the top.
However, there has been a great deal of movement in cities’ ranking within the list. This year, Green Bay, WI; Appleton, WI; Canton, OH; Rockford, IL; and Manchester, NH ranked in the top 5 positions, in comparison with Burlington, VT; Rochester, NY; Columbia, MO; Johnson City, TN; and Syracuse, NY last year.
So, without further ado, here’s what you’ll find in this post:
- Best Real Estate Markets in Each Category: The top 5 cities when it comes to cap rates, rent growth, vacancy rates, and home price appreciation
- Top 60 Up-and-Coming Real Estate Markets 2026: Stats on each of our picks to help you assess the opportunity in each city
- Methodology: The sources from which all of our data was derived, plus a full list of the measures included in our analysis
Cheers to your growth in 2026!
How Do We Identify Up-and-Coming Real Estate Markets?
So, how did we arrive at this year’s list of up-and-coming markets?
First, we examined tried-and-true lists of top-performing and emerging real estate markets from Realtor.com/Wall Street Journal, PricewaterhouseCoopers/The Urban Land Institute, and U.S. News.
Second, we dove into thousands of data points from the National Association of Realtors, Zillow, and the U.S. Census Bureau to analyze every rental market across the country on measures of rent growth, occupancy, property price appreciation, population growth, employment growth, and more.
Lastly, this year, our analyses took an additional factor into account: climate vulnerability. We used data from the Federal Emergency Management Agency to identify which markets are at greatest risk of natural disasters and extreme conditions, though of course, recent years have seen these factors impact some markets that were previously believed to be safe.
Best Real Estate Markets in Each Category
Dive into data-backed insights for the best real estate markets when it comes to cap rates, rent growth, vacancy rates, and home value appreciation.
Note: These rankings apply solely to the markets on our list.
Rental Markets with the Most Rent Growth in 2025

Source: National Association of Realtors – asking rent growth in market-rate multifamily units between Q1-2024 and Q1-2025
Rental Markets with the Lowest Vacancy Rates in 2025
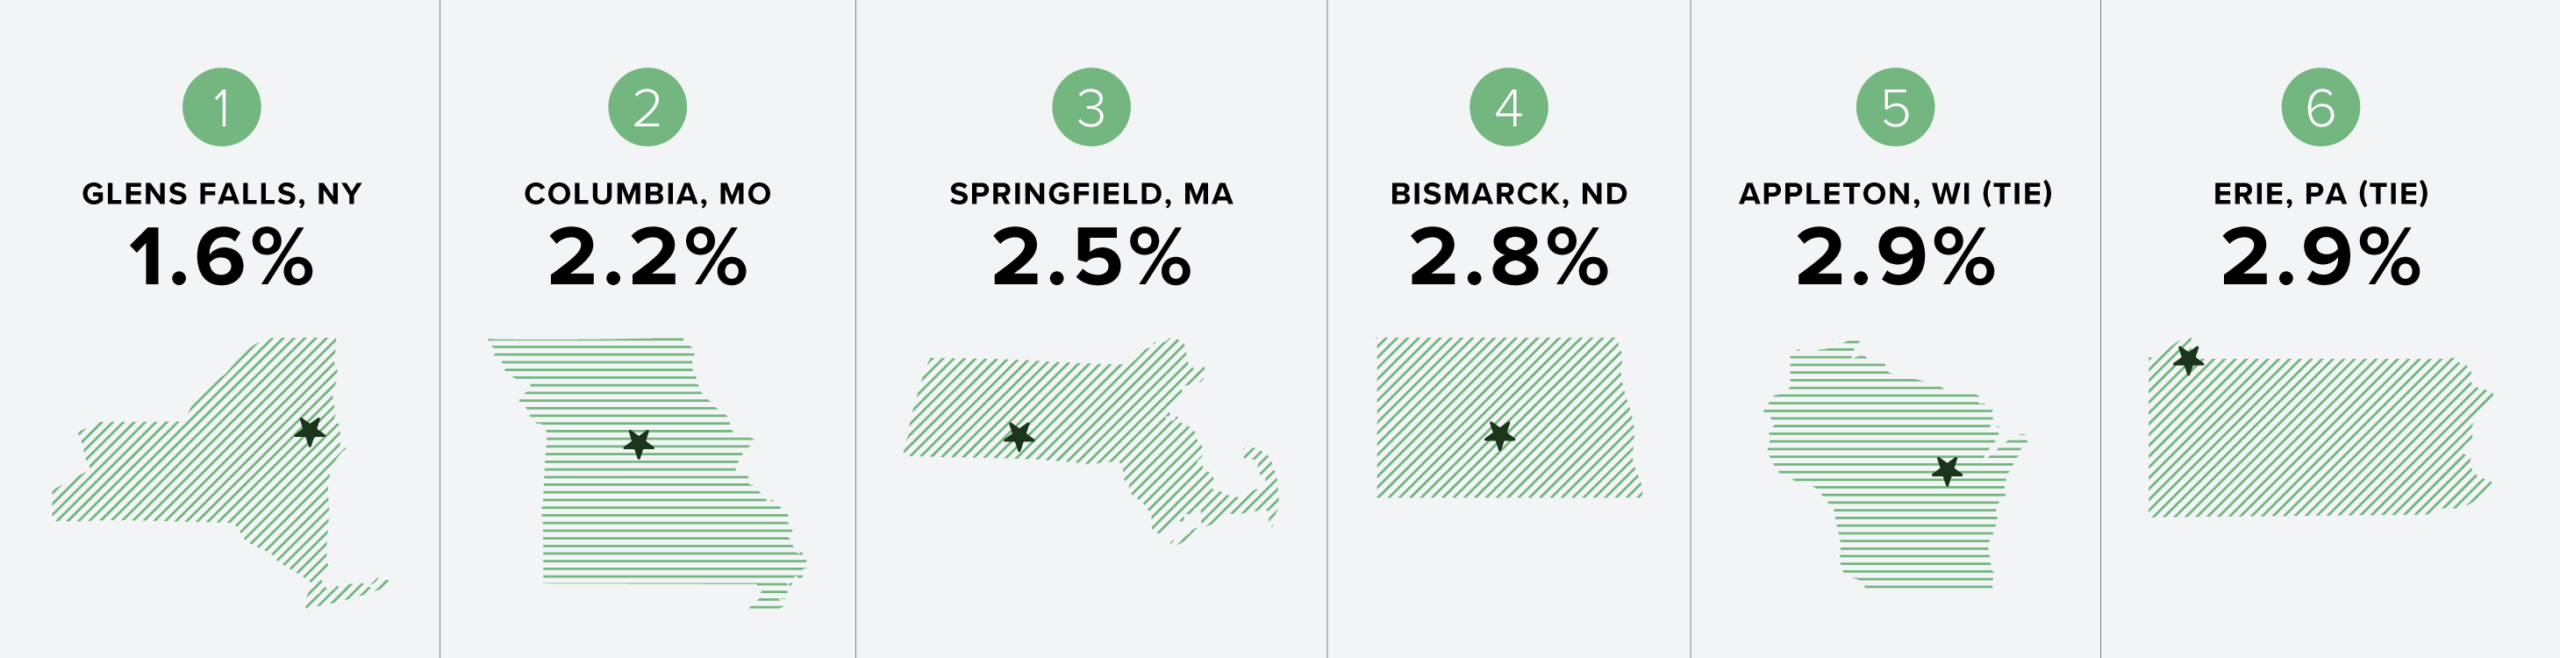
Source: National Association of Realtors – multifamily vacancy rate as of Q1-2025
Rental Markets with the Highest Cap Rates in 2025
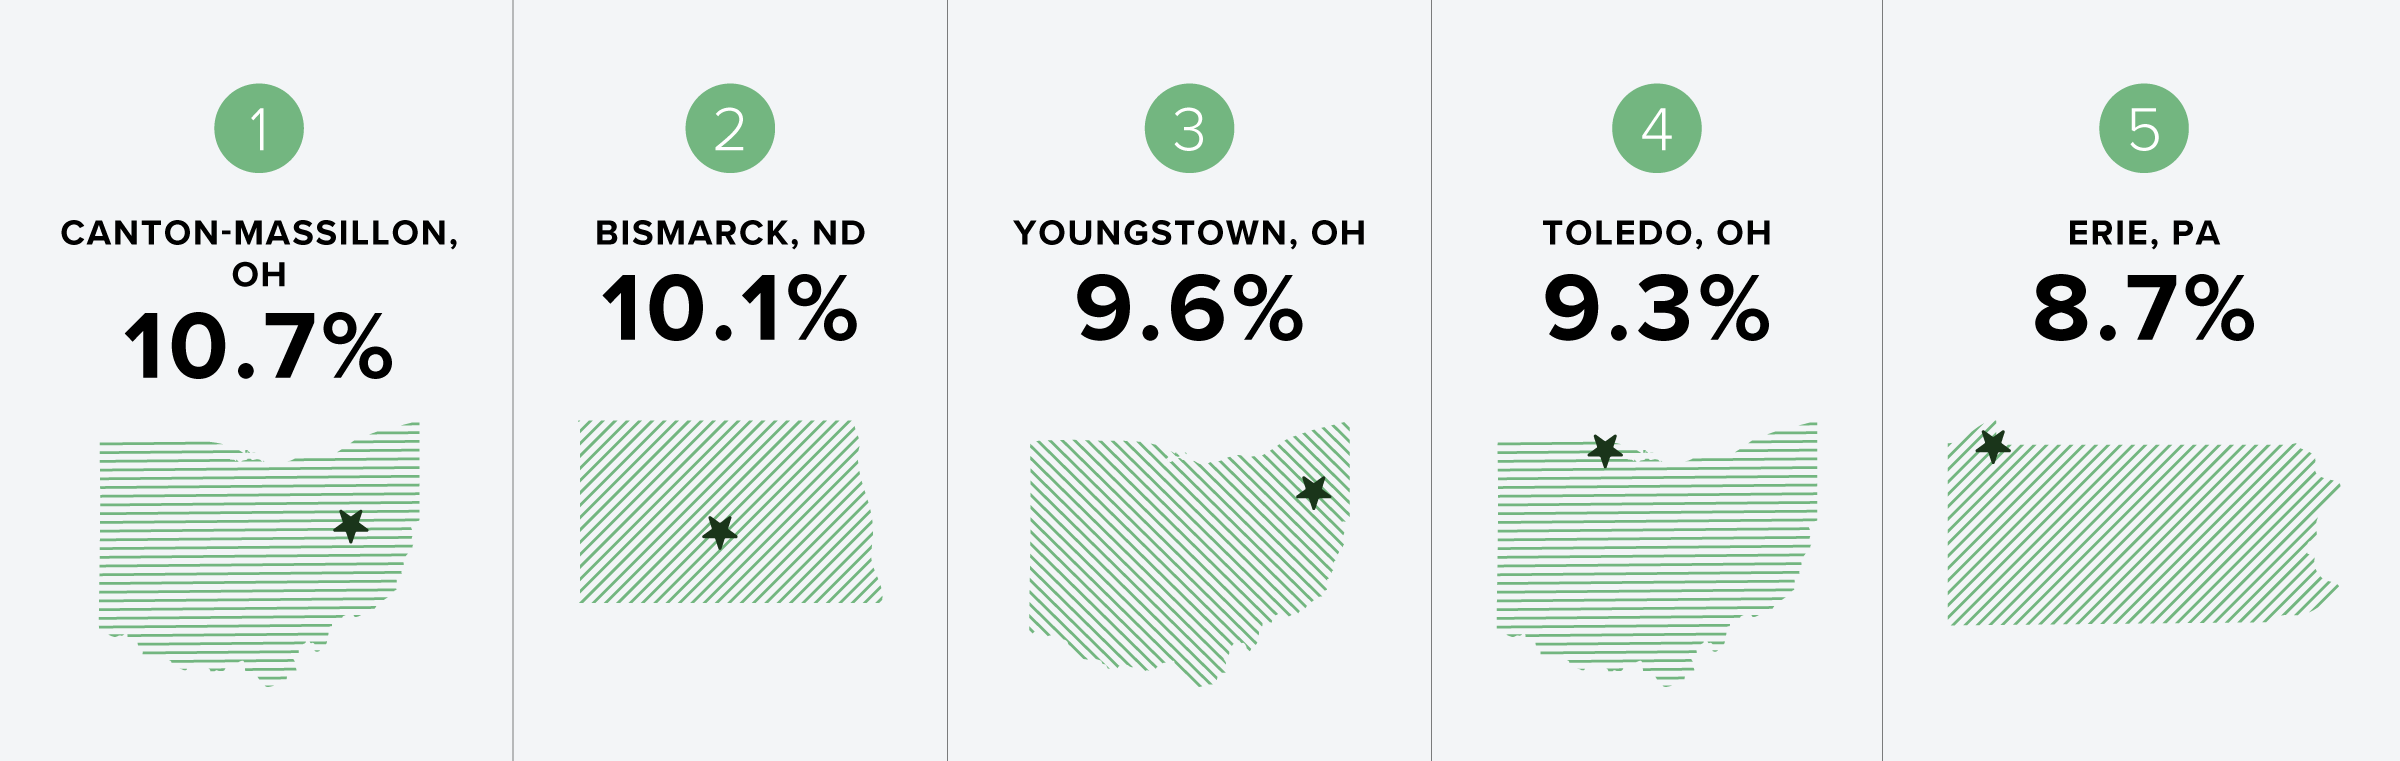
Source: National Association of Realtors – cap rate in market-rate multifamily units as of Q1-2025
Real Estate Markets with the Most Home Value Growth in 2025
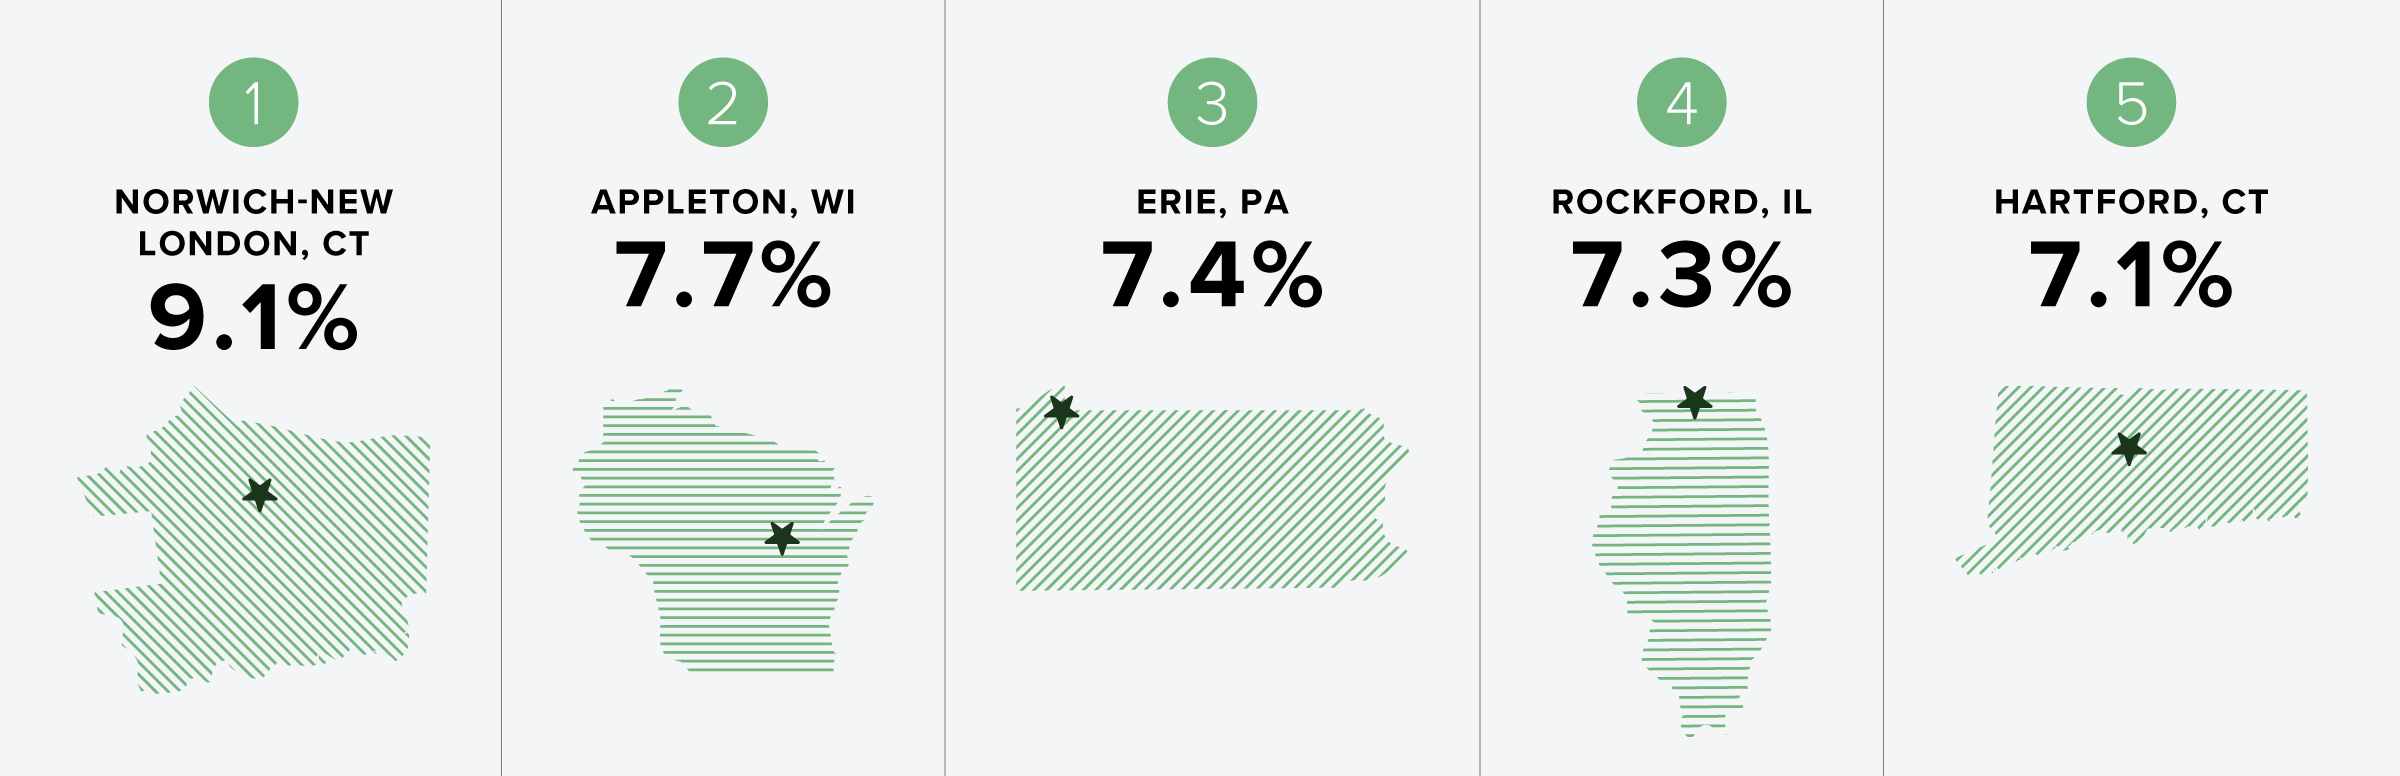
Source: Zillow – change in average home value between September 2024 and September 2025
Top 60 Up-and-Coming Real Estate Markets 2026
#1: Green Bay, WI
↑ 9 positions since last year
Green Bay, Wisconsin Metro Area Population: 331,882
Green Bay, WI Rental Market Statistics:
- Asking Rent Growth Since Q1-’24: 6.2%
- Multifamily Vacancy Rate (Q2-’24): 8.4%
- Multifamily Cap Rate (Q2-’24): 7.5%
Source: National Association of Realtors
Green Bay, WI Housing Market Statistics:
- Average Home Value (2025): $275,499
- Change in Home Value Since 2024: 6.8%
Source: Zillow
Green Bay, WI Economic Statistics:
- Population Growth (2024): 0.1%
- GDP Growth (2023): 3.3%
- Job Growth (Q1-’25): 1.0%
Source: U.S. Census Bureau & National Association of Realtors
Lists That Mention Green Bay, WI:
- Emerging Housing Markets Index – Winter 2025 (Realtor.com/WSJ): #20
- Emerging Housing Markets Index – Spring 2025 (Realtor.com/WSJ): #17
- Emerging Housing Markets Index – Summer 2025 (Realtor.com/WSJ): #13
- Emerging Housing Markets Index – Fall 2025 (Realtor.com/WSJ): #12
- Best Real Estate Markets (WalletHub): #52
- Best Places to Live (U.S. News): #170
#2: Appleton, WI
↑ 10 positions since last year
Appleton, Wisconsin Metro Area Population: 246,433
Appleton, WI Rental Market Statistics:
- Asking Rent Growth Since Q1-’24: 4.0%
- Multifamily Vacancy Rate (Q2-’24): 2.9%
- Multifamily Cap Rate (Q2-’24): 7.5%
Source: National Association of Realtors
Appleton, WI Housing Market Statistics:
- Average Home Value (2025): $291,131
- Change in Home Value Since 2024: 7.7%
Source: Zillow
Appleton, WI Economic Statistics:
- Population Growth (2024): 0.3%
- GDP Growth (2023): 0.9%
- Job Growth (Q1-’25): 0.8%
Source: U.S. Census Bureau & National Association of Realtors
Lists That Mention Appleton, WI:
- Emerging Housing Markets Index – Winter 2025 (Realtor.com/WSJ): #17
- Emerging Housing Markets Index – Spring 2025 (Realtor.com/WSJ): #14
- Emerging Housing Markets Index – Summer 2025 (Realtor.com/WSJ): #8
- Emerging Housing Markets Index – Fall 2025 (Realtor.com/WSJ): #8
- Best Places to Live (U.S. News): #53
#3: Canton-Massillon, OH
↑ 16 positions since last year
Canton-Massillon, Ohio Metro Area Population: 399,474
Canton-Massillon, OH Rental Market Statistics:
- Asking Rent Growth Since Q1-’24: 3.1%
- Multifamily Vacancy Rate (Q2-’24): 4.2%
- Multifamily Cap Rate (Q2-’24): 10.7%
- Source: National Association of Realtors
Canton-Massillon, OH Housing Market Statistics:
- Average Home Value (2025): $165,663
- Change in Home Value Since 2024: 6.3%
Source: Zillow
Canton-Massillon, OH Economic Statistics:
- Population Growth (2024): 0.0%
- GDP Growth (2023): 4.8%
- Job Growth (Q1-’25): 0.6%
Source: U.S. Census Bureau & National Association of Realtors
Lists That Mention Canton-Massillon, OH:
- Emerging Housing Markets Index – Winter 2025 (Realtor.com/WSJ): #1
- Emerging Housing Markets Index – Spring 2025 (Realtor.com/WSJ): #5
- Emerging Housing Markets Index – Summer 2025 (Realtor.com/WSJ): #2
- Emerging Housing Markets Index – Fall 2025 (Realtor.com/WSJ): #4
#4: Rockford, IL
↑ 27 positions since last year
Rockford, Illinois Metro Area Population: 334,124
Rockford, IL Rental Market Statistics:
- Asking Rent Growth Since Q1-’24: 4.4%
- Multifamily Vacancy Rate (Q2-’24): 4.0%
- Multifamily Cap Rate (Q2-’24): 8.1%
Source: National Association of Realtors
Rockford, IL Housing Market Statistics:
- Average Home Value (2025): $172,853
- Change in Home Value Since 2024: 7.3%
Source: Zillow
Rockford, IL Economic Statistics:
- Population Growth (2024): 0.5%
- GDP Growth (2023): -0.2%
- Job Growth (Q1-’25): 0.8%
Source: U.S. Census Bureau & National Association of Realtors
Lists That Mention Rockford, IL:
- Emerging Housing Markets Index – Winter 2025 (Realtor.com/WSJ): #2
- Emerging Housing Markets Index – Spring 2025 (Realtor.com/WSJ): #3
- Emerging Housing Markets Index – Summer 2025 (Realtor.com/WSJ): #9
- Emerging Housing Markets Index – Fall 2025 (Realtor.com/WSJ): #2
- Best Real Estate Markets (WalletHub): #162
#5: Manchester-Nashua, NH
↑ 32 positions since last year
Manchester-Nashua, New Hampshire Metro Area Population: 427,354
Manchester-Nashua, NH Rental Market Statistics:
- Asking Rent Growth Since Q1-’24: 3.4%
- Multifamily Vacancy Rate (Q2-’24): 4.7%
- Multifamily Cap Rate (Q2-’24): 6.3%
Source: National Association of Realtors
Manchester-Nashua, NH Housing Market Statistics:
- Average Home Value (2025): $433,659
- Change in Home Value Since 2024: 1.5%
Source: Zillow
Manchester-Nashua, NH Economic Statistics:
- Population Growth (2024): 0.6%
- GDP Growth (2023): 1.6%
- Job Growth (Q1-’25): 0.1%
Source: U.S. Census Bureau & National Association of Realtors
Lists That Mention Manchester-Nashua, NH:
- Emerging Housing Markets Index – Winter 2025 (Realtor.com/WSJ): #4
- Emerging Housing Markets Index – Spring 2025 (Realtor.com/WSJ): #2
- Emerging Housing Markets Index – Summer 2025 (Realtor.com/WSJ): #1
- Emerging Housing Markets Index – Fall 2025 (Realtor.com/WSJ): #1
- Best Real Estate Markets (WalletHub): #41
#6: Hartford, CT
↑ 26 positions since last year
Hartford-East Hartford-Middletown, Connecticut Metro Area Population: 1,151,543
Hartford, CT Rental Market Statistics:
- Asking Rent Growth Since Q1-’24: 3.8%
- Multifamily Vacancy Rate (Q2-’24): 5.3%
- Multifamily Cap Rate (Q2-’24): 7.2%
Source: National Association of Realtors
Hartford, CT Housing Market Statistics:
- Average Home Value (2025): $198,441
- Change in Home Value Since 2024: 7.1%
Source: Zillow
Hartford, CT Economic Statistics:
- Population Growth (2024): 0.7%
- GDP Growth (2023): 2.3%
- Job Growth (Q1-’25): 0.2%
Source: U.S. Census Bureau & National Association of Realtors
Lists That Mention Hartford, CT:
- Emerging Housing Markets Index – Winter 2025 (Realtor.com/WSJ): #19
- Emerging Housing Markets Index – Spring 2025 (Realtor.com/WSJ): #8
- Emerging Housing Markets Index – Summer 2025 (Realtor.com/WSJ): #10
- Emerging Housing Markets Index – Fall 2025 (Realtor.com/WSJ): #11
- Markets to Watch (PwC/ULI): #81
- Best Real Estate Markets (WalletHub): #265
- Best Places to Live (U.S. News): #19 (West Hartford, CT)
#7: Toledo, OH
↑ 31 positions since last year
Toledo, Ohio Metro Area Population: 600,141
Toledo, OH Rental Market Statistics:
- Asking Rent Growth Since Q1-’24: 3.1%
- Multifamily Vacancy Rate (Q2-’24): 7.3%
- Multifamily Cap Rate (Q2-’24): 9.3%
Source: National Association of Realtors
Toledo, OH Housing Market Statistics:
- Average Home Value (2025): $127,838
- Change in Home Value Since 2024: 4.6%
Source: Zillow
Toledo, OH Economic Statistics:
- Population Growth (2024): -0.1%
- GDP Growth (2023): 2.3%
- Job Growth (Q1-’25): 0.6%
Source: U.S. Census Bureau & National Association of Realtors
Lists That Mention Toledo, OH:
- Emerging Housing Markets Index – Winter 2025 (Realtor.com/WSJ): #3
- Emerging Housing Markets Index – Spring 2025 (Realtor.com/WSJ): #1
- Emerging Housing Markets Index – Summer 2025 (Realtor.com/WSJ): #4
- Emerging Housing Markets Index – Fall 2025 (Realtor.com/WSJ): #7
- Best Real Estate Markets (WalletHub): #287
#8: Milwaukee, WI
New to the list this year
Milwaukee-Waukesha-West Allis, Wisconsin Metro Area Population: 1,560,424
Milwaukee, WI Rental Market Statistics:
- Asking Rent Growth Since Q1-’24: 2.2%
- Multifamily Vacancy Rate (Q2-’24): 6.3%
- Multifamily Cap Rate (Q2-’24): 7.2%
Source: National Association of Realtors
Milwaukee, WI Housing Market Statistics:
- Average Home Value (2025): $218,346
- Change in Home Value Since 2024: 5.0%
Source: Zillow
Milwaukee, WI Economic Statistics:
- Population Growth (2024): 0.1%
- GDP Growth (2023): 1.4%
- Job Growth (Q1-’25): 0.1%
Source: U.S. Census Bureau & National Association of Realtors
Lists That Mention Milwaukee, WI:
- Emerging Housing Markets Index – Winter 2025 (Realtor.com/WSJ): #8
- Emerging Housing Markets Index – Spring 2025 (Realtor.com/WSJ): #9
- Emerging Housing Markets Index – Summer 2025 (Realtor.com/WSJ): #18
- Emerging Housing Markets Index – Fall 2025 (Realtor.com/WSJ): #18
- Markets to Watch (PwC/ULI): #68
- Best Real Estate Markets (WalletHub): #225
#9: Springfield, MA
↑ 2 positions since last year
Springfield, Massachusetts Metro Area Population: 460,291
Springfield, MA Rental Market Statistics:
- Asking Rent Growth Since Q1-’24: 2.5%
- Multifamily Vacancy Rate (Q2-’24): 2.5%
- Multifamily Cap Rate (Q2-’24): 8.0%
Source: National Association of Realtors
Springfield, MA Housing Market Statistics:
- Average Home Value (2025): $293,138
- Change in Home Value Since 2024: 1.9%
Source: Zillow
Springfield, MA Economic Statistics:
- Population Growth (2024): 0.4%
- GDP Growth (2023): 0.7%
- Job Growth (Q1-’25): 0.0%
Source: U.S. Census Bureau & National Association of Realtors
Lists That Mention Springfield, MA:
- Emerging Housing Markets Index – Winter 2025 (Realtor.com/WSJ): #9
- Emerging Housing Markets Index – Spring 2025 (Realtor.com/WSJ): #4
- Emerging Housing Markets Index – Summer 2025 (Realtor.com/WSJ): #3
- Emerging Housing Markets Index – Fall 2025 (Realtor.com/WSJ): #9
- Best Real Estate Markets (WalletHub): #257
#10: Fort Wayne, IN
↓ 1 position since last year
Fort Wayne, Indiana Metro Area Population: 457,842
Fort Wayne, IN Rental Market Statistics:
- Asking Rent Growth Since Q1-’24: 2.1%
- Multifamily Vacancy Rate (Q2-’24): 7.2%
- Multifamily Cap Rate (Q2-’24): 7.9%
Source: National Association of Realtors
Fort Wayne, IN Housing Market Statistics:
- Average Home Value (2025): $237,567
- Change in Home Value Since 2024: 2.1%
Source: Zillow
Fort Wayne, IN Economic Statistics:
- Population Growth (2024): 1.0%
- GDP Growth (2023): 1.4%
- Job Growth (Q1-’25): -0.1%
Source: U.S. Census Bureau & National Association of Realtors
Lists That Mention Fort Wayne, IN:
- Emerging Housing Markets Index – Winter 2025 (Realtor.com/WSJ): #14
- Emerging Housing Markets Index – Spring 2025 (Realtor.com/WSJ): #13
- Emerging Housing Markets Index – Summer 2025 (Realtor.com/WSJ): #19
- Emerging Housing Markets Index – Fall 2025 (Realtor.com/WSJ): #17
- Best Real Estate Markets (WalletHub): #78
#11: Akron, OH
New to the list this year
Akron, Ohio Metro Area Population: 698,398
Akron, OH Rental Market Statistics:
- Asking Rent Growth Since Q1-’24: 3.1%
- Multifamily Vacancy Rate (Q2-’24): 5.9%
- Multifamily Cap Rate (Q2-’24): 8.5%
- Source: National Association of Realtors
Akron, OH Housing Market Statistics:
- Average Home Value (2025): $136,532
- Change in Home Value Since 2024: 0.7%
Source: Zillow
Akron, OH Economic Statistics:
- Population Growth (2024): 0.3%
- GDP Growth (2023): 1.1%
- Job Growth (Q1-’25): 0.2%
Source: U.S. Census Bureau & National Association of Realtors
Lists That Mention Akron, OH:
- Emerging Housing Markets Index – Winter 2025 (Realtor.com/WSJ): #5
- Emerging Housing Markets Index – Spring 2025 (Realtor.com/WSJ): #6
- Emerging Housing Markets Index – Summer 2025 (Realtor.com/WSJ): #11
- Emerging Housing Markets Index – Fall 2025 (Realtor.com/WSJ): #13
- Best Real Estate Markets (WalletHub): #231
#12: Bismarck, ND
↑ 23 positions since last year
Bismarck, North Dakota Metro Area Population: 135,589
Bismarck, ND Rental Market Statistics:
- Asking Rent Growth Since Q1-’24: 5.8%
- Multifamily Vacancy Rate (Q2-’24): 2.8%
- Multifamily Cap Rate (Q2-’24): 10.1%
Source: National Association of Realtors
Bismarck, ND Housing Market Statistics:
- Average Home Value (2025): $363,572
- Change in Home Value Since 2024: 5.1%
Source: Zillow
Bismarck, ND Economic Statistics:
- Population Growth (2024): 1.8%
- GDP Growth (2023): 1.7%
- Job Growth (Q1-’25): 1.4%
Source: U.S. Census Bureau & National Association of Realtors
Lists That Mention Bismarck, ND:
- Best Places to Live (U.S. News): #48
#13: Columbia, MO
↓ 10 positions since last year
Columbia, Missouri Metro Area Population: 215,811
Columbia, MO Rental Market Statistics:
- Asking Rent Growth Since Q1-’24: 6.5%
- Multifamily Vacancy Rate (Q2-’24): 2.2%
- Multifamily Cap Rate (Q2-’24): 8.1%
Source: National Association of Realtors
Columbia, MO Housing Market Statistics:
- Average Home Value (2025): $314,987
- Change in Home Value Since 2024: 3.9%
Source: Zillow
Columbia, MO Economic Statistics:
- Population Growth (2024): 0.9%
- GDP Growth (2023): 2.8%
- Job Growth (Q1-’25): 0.9%
Source: U.S. Census Bureau & National Association of Realtors
Lists That Mention Columbia, MO:
- Best Places to Live (U.S. News): #193
#14: New Haven, CT
New to the list this year
New Haven-Milford, Connecticut Metro Area Population: 568,158
New Haven, CT Rental Market Statistics:
- Asking Rent Growth Since Q1-’24: 2.6%
- Multifamily Vacancy Rate (Q2-’24): 6.2%
- Multifamily Cap Rate (Q2-’24): 6.9%
Source: National Association of Realtors
New Haven, CT Housing Market Statistics:
- Average Home Value (2025): $320,181
- Change in Home Value Since 2024: 3.9%
Source: Zillow
New Haven, CT Economic Statistics:
- Population Growth (2024): 1.0%
- GDP Growth (2023): 2.0%
- Job Growth (Q1-’25): -0.4%
Source: U.S. Census Bureau & National Association of Realtors
Lists That Mention New Haven, CT:
- Emerging Housing Markets Index – Spring 2025 (Realtor.com/WSJ): #11
- Emerging Housing Markets Index – Summer 2025 (Realtor.com/WSJ): #5
- Emerging Housing Markets Index – Fall 2025 (Realtor.com/WSJ): #20
- Best Real Estate Markets (WalletHub): #229
#15: South Bend, IN
↑ 7 positions since last year
South Bend-Mishawaka, Indiana Metro Area Population: 324,490
South Bend, IN Rental Market Statistics:
- Asking Rent Growth Since Q1-’24: 6.1%
- Multifamily Vacancy Rate (Q2-’24): 6.5%
- Multifamily Cap Rate (Q2-’24): 7.4%
Source: National Association of Realtors
South Bend, IN Housing Market Statistics:
- Average Home Value (2025): $185,239
- Change in Home Value Since 2024: 4.2%
Source: Zillow
South Bend, IN Economic Statistics:
- Population Growth (2024): 0.0%
- GDP Growth (2023): 3.5%
- Job Growth (Q1-’25): 1.9%
Source: U.S. Census Bureau & National Association of Realtors
Lists That Mention South Bend, IN:
- Emerging Housing Markets Index – Winter 2025 (Realtor.com/WSJ): #7
- Emerging Housing Markets Index – Spring 2025 (Realtor.com/WSJ): #15
- Emerging Housing Markets Index – Fall 2025 (Realtor.com/WSJ): #3
#16: Lincoln, NE
↑ 11 positions since last year
Lincoln, Nebraska Metro Area Population: 343,620
Lincoln, NE Rental Market Statistics:
- Asking Rent Growth Since Q1-’24: 3.1%
- Multifamily Vacancy Rate (Q2-’24): 5.7%
- Multifamily Cap Rate (Q2-’24): 7.2%
Source: National Association of Realtors
Lincoln, NE Housing Market Statistics:
- Average Home Value (2025): $286,251
- Change in Home Value Since 2024: 3.6%
Source: Zillow
Lincoln, NE Economic Statistics:
- Population Growth (2024): 1.3%
- GDP Growth (2023): 3.3%
- Job Growth (Q1-’25): 1.3%
Source: U.S. Census Bureau & National Association of Realtors
Lists That Mention Lincoln, NE:
#17: Reading, PA
↑ 19 positions since last year
Reading, Pennsylvania Metro Area Population: 432,821
Reading, PA Rental Market Statistics:
- Asking Rent Growth Since Q1-’24: 2.1%
- Multifamily Vacancy Rate (Q2-’24): 4.3%
- Multifamily Cap Rate (Q2-’24): 7.5%
Source: National Association of Realtors
Reading, PA Housing Market Statistics:
- Average Home Value (2025): $255,129
- Change in Home Value Since 2024: 5.7%
Source: Zillow
Reading, PA Economic Statistics:
- Population Growth (2024): 0.7%
- GDP Growth (2023): 2.5%
- Job Growth (Q1-’25): 1.6%
Source: U.S. Census Bureau & National Association of Realtors
Lists That Mention Reading, PA:
- Emerging Housing Markets Index – Winter 2025 (Realtor.com/WSJ): #18
- Emerging Housing Markets Index – Spring 2025 (Realtor.com/WSJ): #10
- Emerging Housing Markets Index – Fall 2025 (Realtor.com/WSJ): #19
#18: Worcester, MA
↓ 3 positions since last year
Worcester, Massachusetts-Connecticut Metro Area Population: 866,866
Worcester, MA Rental Market Statistics:
- Asking Rent Growth Since Q1-’24: 3.1%
- Multifamily Vacancy Rate (Q2-’24): 5.0%
- Multifamily Cap Rate (Q2-’24): 6.6%
Source: National Association of Realtors
Worcester, MA Housing Market Statistics:
- Average Home Value (2025): $429,635
- Change in Home Value Since 2024: 0.7%
Source: Zillow
Worcester, MA Economic Statistics:
- Population Growth (2024): 1.0%
- GDP Growth (2023): 0.5%
- Job Growth (Q1-’25): -0.4%
Source: U.S. Census Bureau & National Association of Realtors
Lists That Mention Worcester, MA:
- Emerging Housing Markets Index – Winter 2025 (Realtor.com/WSJ): #10
- Emerging Housing Markets Index – Spring 2025 (Realtor.com/WSJ): #16
- Emerging Housing Markets Index – Summer 2025 (Realtor.com/WSJ): #7
- Emerging Housing Markets Index – Fall 2025 (Realtor.com/WSJ): #15
- Best Real Estate Markets (WalletHub): #75
#19: Harrisburg, PA
↑ 6 positions since last year
Harrisburg-Carlisle, Pennsylvania Metro Area Population: 606,055
Harrisburg, PA Rental Market Statistics:
- Asking Rent Growth Since Q1-’24: 4.5%
- Multifamily Vacancy Rate (Q2-’24): 6.7%
- Multifamily Cap Rate (Q2-’24): 7.0%
Source: National Association of Realtors
Harrisburg, PA Housing Market Statistics:
- Average Home Value (2025): $257,983
- Change in Home Value Since 2024: 5.2%
Source: Zillow
Harrisburg, PA Economic Statistics:
- Population Growth (2024): 0.7%
- GDP Growth (2023): 1.2%
- Job Growth (Q1-’25): 1.6%
Source: U.S. Census Bureau & National Association of Realtors
Lists That Mention Harrisburg, PA:
- Emerging Housing Markets Index – Winter 2025 (Realtor.com/WSJ): #13
- Emerging Housing Markets Index – Spring 2025 (Realtor.com/WSJ): #7
- Emerging Housing Markets Index – Summer 2025 (Realtor.com/WSJ): #17
- Emerging Housing Markets Index – Fall 2025 (Realtor.com/WSJ): #14
#20: Lansing, MI
↑ 27 positions since last year
Lansing-East Lansing, Michigan Metro Area Population: 473,177
Lansing, MI Rental Market Statistics:
- Asking Rent Growth Since Q1-’24: 2.9%
- Multifamily Vacancy Rate (Q2-’24): 5.4%
- Multifamily Cap Rate (Q2-’24): 7.6%
Source: National Association of Realtors
Lansing, MI Housing Market Statistics:
- Average Home Value (2025): $161,774
- Change in Home Value Since 2024: 4.8%
Source: Zillow
Lansing, MI Economic Statistics:
- Population Growth (2024): 1.0%
- GDP Growth (2023): 2.1%
- Job Growth (Q1-’25): 1.3%
Source: U.S. Census Bureau & National Association of Realtors
Lists That Mention Lansing, MI:
- Emerging Housing Markets Index – Summer 2025 (Realtor.com/WSJ): #6
- Emerging Housing Markets Index – Fall 2025 (Realtor.com/WSJ): #5
- Best Real Estate Markets (WalletHub): #135
#21: Oklahoma City, OK
↑ 13 positions since last year
Oklahoma City, Oklahoma Metro Area Population: 1,477,926
Oklahoma City, OK Rental Market Statistics:
- Asking Rent Growth Since Q1-’24: 2.2%
- Multifamily Vacancy Rate (Q2-’24): 11.4%
- Multifamily Cap Rate (Q2-’24): 7.5%
Source: National Association of Realtors
Oklahoma City, OK Housing Market Statistics:
- Average Home Value (2025): $203,240
- Change in Home Value Since 2024: -0.3%
Source: Zillow
Oklahoma City, OK Economic Statistics:
- Population Growth (2024): 1.2%
- GDP Growth (2023): 6.9%
- Job Growth (Q1-’25): 1.1%
Source: U.S. Census Bureau & National Association of Realtors
Lists That Mention Oklahoma City, OK:
- Markets to Watch (PwC/ULI): #55
- Best Real Estate Markets (WalletHub): #109
- Best Places to Live (U.S. News): #96
#22: Dayton, OH
↑ 30 positions since last year
Dayton-Kettering, Ohio Metro Area Population: 814,363
Dayton, OH Rental Market Statistics:
- Asking Rent Growth Since Q1-’24: 3.6%
- Multifamily Vacancy Rate (Q2-’24): 6.4%
- Multifamily Cap Rate (Q2-’24): 7.6%
Source: National Association of Realtors
Dayton, OH Housing Market Statistics:
- Average Home Value (2025): $133,365
- Change in Home Value Since 2024: 2.6%
Source: Zillow
Dayton, OH Economic Statistics:
- Population Growth (2024): 0.3%
- GDP Growth (2023): 2.3%
- Job Growth (Q1-’25): -0.1%
Source: U.S. Census Bureau & National Association of Realtors
Lists That Mention Dayton, OH:
- Emerging Housing Markets Index – Winter 2025 (Realtor.com/WSJ): #11
- Emerging Housing Markets Index – Spring 2025 (Realtor.com/WSJ): #19
- Best Real Estate Markets (WalletHub): #268
#23: Madison, WI
↓ 2 positions since last year
Madison, Wisconsin Metro Area Population: 694,345
Madison, WI Rental Market Statistics:
- Asking Rent Growth Since Q1-’24: 2.5%
- Multifamily Vacancy Rate (Q2-’24): 5.1%
- Multifamily Cap Rate (Q2-’24): 6.4%
Source: National Association of Realtors
Madison, WI Housing Market Statistics:
- Average Home Value (2025): $418,941
- Change in Home Value Since 2024: 1.8%
Source: Zillow
Madison, WI Economic Statistics:
- Population Growth (2024): 1.5%
- GDP Growth (2023): 3.2%
- Job Growth (Q1-’25): -0.2%
Source: U.S. Census Bureau & National Association of Realtors
Lists That Mention Madison, WI:
#24: Fargo, ND
↑ 18 positions since last year
Fargo, North Dakota-Minnesota Metro Area Population: 262,620
Fargo, ND Rental Market Statistics:
- Asking Rent Growth Since Q1-’24: 1.9%
- Multifamily Vacancy Rate (Q2-’24): 7.1%
- Multifamily Cap Rate (Q2-’24): 8.7%
Source: National Association of Realtors
Fargo, ND Housing Market Statistics:
- Average Home Value (2025): $316,580
- Change in Home Value Since 2024: 2.9%
Source: Zillow
Fargo, ND Economic Statistics:
- Population Growth (2024): 1.4%
- GDP Growth (2023): 3.6%
- Job Growth (Q1-’25): -0.3%
Source: U.S. Census Bureau & National Association of Realtors
Lists That Mention Fargo, ND:
- Best Places to Live (U.S. News): #110
#25: Columbus, OH
New to the list this year
Columbus, Ohio Metro Area Population: 2,180,271
Columbus, OH Rental Market Statistics:
- Asking Rent Growth Since Q1-’24: 2.6%
- Multifamily Vacancy Rate (Q2-’24): 8.7%
- Multifamily Cap Rate (Q2-’24): 6.7%
Source: National Association of Realtors
Columbus, OH Housing Market Statistics:
- Average Home Value (2025): $244,665
- Change in Home Value Since 2024: 0.6%
Source: Zillow
Columbus, OH Economic Statistics:
- Population Growth (2024): 1.4%
- GDP Growth (2023): 1.8%
- Job Growth (Q1-’25): 1.0%
Source: U.S. Census Bureau & National Association of Realtors
Lists That Mention Columbus, OH:
- Emerging Housing Markets Index – Winter 2025 (Realtor.com/WSJ): #15
- Markets to Watch (PwC/ULI): #38
- Best Real Estate Markets (WalletHub): #104
#26: Albany, NY
New to the list this year
Albany-Schenectady-Troy, New York Metro Area Population: 904,682
Albany, NY Rental Market Statistics:
- Asking Rent Growth Since Q1-’24: 2.5%
- Multifamily Vacancy Rate (Q2-’24): 4.5%
- Multifamily Cap Rate (Q2-’24): 7.8%
Source: National Association of Realtors
Albany, NY Housing Market Statistics:
- Average Home Value (2025): $317,641
- Change in Home Value Since 2024: 4.7%
Source: Zillow
Albany, NY Economic Statistics:
- Population Growth (2024): 0.0%
- GDP Growth (2023): 2.5%
- Job Growth (Q1-’25): 1.3%
Source: U.S. Census Bureau & National Association of Realtors
Lists That Mention Albany, NY:
- Best Real Estate Markets (WalletHub): #209
#27: Lexington, KY
↑ 24 positions since last year
Lexington-Fayette, Kentucky Metro Area Population: 520,045
Lexington, KY Rental Market Statistics:
- Asking Rent Growth Since Q1-’24: 3.9%
- Multifamily Vacancy Rate (Q2-’24): 7.7%
- Multifamily Cap Rate (Q2-’24): 6.5%
Source: National Association of Realtors
Lexington, KY Housing Market Statistics:
- Average Home Value (2025): $321,311
- Change in Home Value Since 2024: 3.2%
Source: Zillow
Lexington, KY Economic Statistics:
- Population Growth (2024): 1.5%
- GDP Growth (2023): 2.7%
- Job Growth (Q1-’25): 0.7%
Source: U.S. Census Bureau & National Association of Realtors
Lists That Mention Lexington, KY:
#28: Rochester, NY (tie)
↓ 26 positions since last year
Rochester, New York Metro Area Population: 1,052,087
Rochester, NY Rental Market Statistics:
- Asking Rent Growth Since Q1-’24: 4.2%
- Multifamily Vacancy Rate (Q2-’24): 5.0%
- Multifamily Cap Rate (Q2-’24): 8.3%
Source: National Association of Realtors
Rochester, NY Housing Market Statistics:
- Average Home Value (2025): $231,623
- Change in Home Value Since 2024: 3.1%
Source: Zillow
Rochester, NY Economic Statistics:
- Population Growth (2024): 0.0%
- GDP Growth (2023): 0.1%
- Job Growth (Q1-’25): 1.3%
Source: U.S. Census Bureau & National Association of Realtors
Lists That Mention Rochester, NY:
- Best Real Estate Markets (WalletHub): #72
#28: Champaign-Urbana, IL (tie)
↑ 18 positions since last year
Champaign-Urbana, Illinois Metro Area Population: 237,052
Champaign-Urbana, IL Rental Market Statistics:
- Asking Rent Growth Since Q1-’24: 3.7%
- Multifamily Vacancy Rate (Q2-’24): 6.3%
- Multifamily Cap Rate (Q2-’24): 7.5%
Source: National Association of Realtors
Champaign-Urbana, IL Housing Market Statistics:
- Average Home Value (2025): $228,282
- Change in Home Value Since 2024: 5.3%
Source: Zillow
Champaign-Urbana, IL Economic Statistics:
- Population Growth (2025): 1.4%
- GDP Growth (2023): 3.3%
- Job Growth (Q1-’25): 1.8%
Source: U.S. Census Bureau & National Association of Realtors
Lists That Mention Champaign-Urbana, IL:
- None – this is an under-the-radar pick
#30: Fayetteville, AR
↓ 13 positions since last year
Fayetteville-Springdale-Rogers, Arkansas Metro Area Population: 590,295
Fayetteville, AR Rental Market Statistics:
- Asking Rent Growth Since Q1-’24: 2.8%
- Multifamily Vacancy Rate (Q2-’24): 9.2%
- Multifamily Cap Rate (Q2-’24): 6.3%
Source: National Association of Realtors
Fayetteville, AR Housing Market Statistics:
- Average Home Value (2025): $372,445
- Change in Home Value Since 2024: 3.5%
Source: Zillow
Fayetteville, AR Economic Statistics:
- Population Growth (2024): 1.6%
- GDP Growth (2023): 1.4%
- Job Growth (Q1-’25): 2.6%
Source: U.S. Census Bureau & National Association of Realtors
Lists That Mention Fayetteville, AR:
#31: Pittsburgh, PA
↑ 12 positions since last year
Pittsburgh, Pennsylvania Metro Area Population: 2,422,725
Pittsburgh, PA Rental Market Statistics:
Asking Rent Growth Since Q1-’24: 3.1%
Multifamily Vacancy Rate (Q2-’24): 6.2%
Multifamily Cap Rate (Q2-’24): 8.0%
Source: National Association of Realtors
Pittsburgh, PA Housing Market Statistics:
Average Home Value (2025): $235,082
Change in Home Value Since 2024: 0.8%
Source: Zillow
Pittsburgh, PA Economic Statistics:
Population Growth (2024): 1.0%
GDP Growth (2023): 2.9%
Job Growth (Q1-’25): 0.6%
Source: U.S. Census Bureau & National Association of Realtors
Lists That Mention Pittsburgh, PA:
Markets to Watch (PwC/ULI): #29
Best Real Estate Markets (WalletHub): #200
Best Places to Live (U.S. News): #238
#32: Glens Falls, NY
↑ 24 positions since last year
Glens Falls, New York Metro Area Population: 125,427
Glens Falls, NY Rental Market Statistics:
Asking Rent Growth Since Q1-’24: 3.7%
Multifamily Vacancy Rate (Q2-’24): 1.6%
Multifamily Cap Rate (Q2-’24): 7.8%
Source: National Association of Realtors
Glens Falls, NY Housing Market Statistics:
Average Home Value (2025): $264,073
Change in Home Value Since 2024: 1.6%
Source: Zillow
Glens Falls, NY Economic Statistics:
Population Growth (2024): Unavailable
GDP Growth (2023): 1.9%
Job Growth (Q1-’25): 0.8%
Source: U.S. Census Bureau & National Association of Realtors
Lists That Mention Glens Falls, NY:
None – this is an under-the-radar pick
#33: Hagerstown, MD
New to the list this year
Hagerstown-Martinsburg, MD-WV Metro Area Population: 304,506
Hagerstown, MD Rental Market Statistics:
Asking Rent Growth Since Q1-’24: 4.6%
Multifamily Vacancy Rate (Q2-’24): 5.6%
Multifamily Cap Rate (Q2-’24): 7.4%
Source: National Association of Realtors
Hagerstown, MD Housing Market Statistics:
Average Home Value (2025): $300,451
Change in Home Value Since 2024: 2.0%
Source: Zillow
Hagerstown, MD Economic Statistics:
Population Growth (2024): 0.6%
GDP Growth (2023): 3.4%
Job Growth (Q1-’25): -0.3%
Source: U.S. Census Bureau & National Association of Realtors
Lists That Mention Hagerstown, MD:
Emerging Housing Markets Index – Summer 2025 (Realtor.com/WSJ): #15
Emerging Housing Markets Index – Fall 2025 (Realtor.com/WSJ): #10
#34: Johnson City, TN
↓ 30 positions since last year
Johnson City, Tennessee Metro Area Population: 212,561
Johnson City, TN Rental Market Statistics:
Asking Rent Growth Since Q1-’24: 4.0%
Multifamily Vacancy Rate (Q2-’24): 3.3%
Multifamily Cap Rate (Q2-’24): 7.3%
Source: National Association of Realtors
Johnson City, TN Housing Market Statistics:
Average Home Value (2025): $290,209
Change in Home Value Since 2024: -0.2%
Source: Zillow
Johnson City, TN Economic Statistics:
Population Growth (2024): 0.3%
GDP Growth (2023): 4.2%
Job Growth (Q1-’25): -0.1%
Source: U.S. Census Bureau & National Association of Realtors
Lists That Mention Johnson City, TN:
Best Places to Live (U.S. News): #181
#35: Erie, PA
↓ 27 positions since last year
Erie, Pennsylvania Metro Area Population: 267,571
Erie, PA Rental Market Statistics:
Asking Rent Growth Since Q1-’24: 6.8%
Multifamily Vacancy Rate (Q2-’24): 2.9%
Multifamily Cap Rate (Q2-’24): 8.7%
Source: National Association of Realtors
Erie, PA Housing Market Statistics:
Average Home Value (2025): $197,627
Change in Home Value Since 2024: 7.4%
Source: Zillow
Erie, PA Economic Statistics:
Population Growth (2024): -0.3%
GDP Growth (2023): 1.5%
Job Growth (Q1-’25): 0.8%
Source: U.S. Census Bureau & National Association of Realtors
Lists That Mention Erie, PA:
Best Real Estate Markets (WalletHub): #235
#36: Youngstown, OH
↑ 3 positions since last year
Youngstown-Warren-Boardman, Ohio-Pennsylvania Metro Area Population: 425,969
Youngstown, OH Rental Market Statistics:
Asking Rent Growth Since Q1-’24: 4.0%
Multifamily Vacancy Rate (Q2-’24): 4.6%
Multifamily Cap Rate (Q2-’24): 9.6%
Source: National Association of Realtors
Youngstown, OH Housing Market Statistics:
Average Home Value (2025): $67,355
Change in Home Value Since 2024: 2.1%
Source: Zillow
Youngstown, OH Economic Statistics:
Population Growth (2024): -0.1%
GDP Growth (2023): 2.0%
Job Growth (Q1-’25): 0.6%
Source: U.S. Census Bureau & National Association of Realtors
Lists That Mention Youngstown, OH:
Emerging Housing Markets Index – Spring 2025 (Realtor.com/WSJ): #18
#37: Amarillo, TX
New to the list this year
Amarillo, Texas Metro Area Population: 273,100
Amarillo, TX Rental Market Statistics:
Asking Rent Growth Since Q1-’24: 2.3%
Multifamily Vacancy Rate (Q2-’24): 10.9%
Multifamily Cap Rate (Q2-’24): 8.3%
Source: National Association of Realtors
Amarillo, TX Housing Market Statistics:
Average Home Value (2025): $200,755
Change in Home Value Since 2024: 0.7%
Source: Zillow
Amarillo, TX Economic Statistics:
Population Growth (2024): 0.5%
GDP Growth (2023): 3.9%
Job Growth (Q1-’25): 1.2%
Source: U.S. Census Bureau & National Association of Realtors
Lists That Mention Amarillo, TX:
Best Real Estate Markets (WalletHub): #210
Best Places to Live (U.S. News): #137
#38: Omaha, NE
↓ 32 positions since last year
Omaha, Nebraska Metro Area Population: 984,548
Omaha, NE Rental Market Statistics:
Asking Rent Growth Since Q1-’24: 3.5%
Multifamily Vacancy Rate (Q2-’24): 6.0%
Multifamily Cap Rate (Q2-’24): 6.9%
Source: National Association of Realtors
Omaha, NE Housing Market Statistics:
Average Home Value (2025): $286,995
Change in Home Value Since 2024: 0.6%
Source: Zillow
Omaha, NE Economic Statistics:
Population Growth (2024): 0.5%
GDP Growth (2023): 2.2%
Job Growth (Q1-’25): 0.0%
Source: U.S. Census Bureau & National Association of Realtors
Lists That Mention Omaha, NE:
Markets to Watch (PwC/ULI): #52
Best Real Estate Markets (WalletHub): #84
Best Places to Live (U.S. News): #131
#39: Durham, NC
New to the list this year
Durham-Chapel Hill, North Carolina Metro Area Population: 608,879
Durham, NC Rental Market Statistics:
Asking Rent Growth Since Q1-’24: -0.9%
Multifamily Vacancy Rate (Q2-’24): 12.0%
Multifamily Cap Rate (Q2-’24): 5.5%
Source: National Association of Realtors
Durham, NC Housing Market Statistics:
Average Home Value (2025): $399,063
Change in Home Value Since 2024: -1.5%
Source: Zillow
Durham, NC Economic Statistics:
Population Growth (2024): 1.9%
GDP Growth (2023): 3.5%
Job Growth (Q1-’25): 1.7%
Source: U.S. Census Bureau & National Association of Realtors
Lists That Mention Durham, NC:
Markets to Watch (PwC/ULI): #11
Best Real Estate Markets (WalletHub): #4
Best Places to Live (U.S. News): #202
#40: Ann Arbor, MI
New to the list this year
Ann Arbor, Michigan Metro Area Population: 365,536
Ann Arbor, MI Rental Market Statistics:
Asking Rent Growth Since Q1-’24: 3.0%
Multifamily Vacancy Rate (Q2-’24): 7.3%
Multifamily Cap Rate (Q2-’24): 6.7%
Source: National Association of Realtors
Ann Arbor, MI Housing Market Statistics:
Average Home Value (2025): $514,905
Change in Home Value Since 2024: 2.4%
Source: Zillow
Ann Arbor, MI Economic Statistics:
Population Growth (2024): 0.2%
GDP Growth (2023): 2.9%
Job Growth (Q1-’25): 1.4%
Source: U.S. Census Bureau & National Association of Realtors
Lists That Mention Ann Arbor, MI:
Emerging Housing Markets Index – Summer 2025 (Realtor.com/WSJ): #20
Best Real Estate Markets (WalletHub): #88
#41: Raleigh, NC
New to the list this year
Raleigh-Cary, North Carolina Metro Area Population: 1,509,231
Raleigh, NC Rental Market Statistics:
Asking Rent Growth Since Q1-’24: -1.2%
Multifamily Vacancy Rate (Q2-’24): 12.6%
Multifamily Cap Rate (Q2-’24): 5.2%
Source: National Association of Realtors
Raleigh, NC Housing Market Statistics:
Average Home Value (2025): $435,712
Change in Home Value Since 2024: -2.8%
Source: Zillow
Raleigh, NC Economic Statistics:
Population Growth (2024): 1.8%
GDP Growth (2023): 4.6%
Job Growth (Q1-’25): 2.0%
Source: U.S. Census Bureau & National Association of Realtors
Lists That Mention Raleigh, NC:
Markets to Watch (PwC/ULI): #11
Best Real Estate Markets (WalletHub): #13
Best Places to Live (U.S. News): #155
#42: Springfield, MO
↓ 28 positions since last year
Springfield, Missouri Metro Area Population: 490,886
Springfield, MO Rental Market Statistics:
Asking Rent Growth Since Q1-’24: 4.2%
Multifamily Vacancy Rate (Q2-’24): 5.5%
Multifamily Cap Rate (Q2-’24): 7.7%
Source: National Association of Realtors
Springfield, MO Housing Market Statistics:
Average Home Value (2025): $237,633
Change in Home Value Since 2024: 0.2%
Source: Zillow
Springfield, MO Economic Statistics:
Population Growth (2024): 0.1%
GDP Growth (2023): 2.2%
Job Growth (Q1-’25): 1.4%
Source: U.S. Census Bureau & National Association of Realtors
Lists That Mention Springfield, MO:
Best Real Estate Markets (WalletHub): #124
#43: Des Moines, IA
New to the list this year
Des Moines-West Des Moines, Iowa Metro Area Population: 737,164
Des Moines, IA Rental Market Statistics:
Asking Rent Growth Since Q1-’24: 1.1%
Multifamily Vacancy Rate (Q2-’24): 9.0%
Multifamily Cap Rate (Q2-’24): 7.9%
Source: National Association of Realtors
Des Moines, IA Housing Market Statistics:
Average Home Value (2025): $208,187
Change in Home Value Since 2024: 1.1%
Source: Zillow
Des Moines, IA Economic Statistics:
Population Growth (2024): 1.0%
GDP Growth (2023): 1.0%
Job Growth (Q1-’25): -1.0%
Source: U.S. Census Bureau & National Association of Realtors
Lists That Mention Des Moines, IA:
Markets to Watch (PwC/ULI): #53
Best Real Estate Markets (WalletHub): #279
Best Places to Live (U.S. News): #31 (West Des Moines, IA)
#44: Providence, RI
New to the list this year
Providence-Warwick, Rhode Island-Massachusetts Metro Area Population: 1,677,803
Providence, RI Rental Market Statistics:
Asking Rent Growth Since Q1-’24: 3.9%
Multifamily Vacancy Rate (Q2-’24): 3.2%
Multifamily Cap Rate (Q2-’24): 7.3%
Source: National Association of Realtors
Providence, RI Housing Market Statistics:
Average Home Value (2025): $421,311
Change in Home Value Since 2024: 1.3%
Source: Zillow
Providence, RI Economic Statistics:
Population Growth (2024): 1.1%
GDP Growth (2023): 1.2%
Job Growth (Q1-’25): -0.3%
Source: U.S. Census Bureau & National Association of Realtors
Lists That Mention Providence, RI:
Markets to Watch (PwC/ULI): #77
Best Real Estate Markets (WalletHub): #141
#45: Bloomington, IL
↓ 27 positions since last year
Bloomington, IL Metro Area Population: 170,441
Bloomington, IL Rental Market Statistics:
Asking Rent Growth Since Q1-’24: 1.5%
Multifamily Vacancy Rate (Q2-’24): 4.4%
Multifamily Cap Rate (Q2-’24): 8.1%
Source: National Association of Realtors
Bloomington, IL Housing Market Statistics:
Average Home Value (2025): $259,478
Change in Home Value Since 2024: 7.1%
Source: Zillow
Bloomington, IL Economic Statistics:
Population Growth (2024): 0.4%
GDP Growth (2023): -0.2%
Job Growth (Q1-’25): -2.5%
Source: U.S. Census Bureau & National Association of Realtors
Lists That Mention Bloomington, IL:
Best Places to Live (U.S. News): #168
#46: Oshkosh-Neenah, WI
↓ 16 positions since last year
Oshkosh-Neena, Wisconsin Metro Area Population: 171,735
Oshkosh-Neenah, WI Rental Market Statistics:
Asking Rent Growth Since Q1-’24: 3.7%
Multifamily Vacancy Rate (Q2-’24): 4.8%
Multifamily Cap Rate (Q2-’24): 7.8%
Source: National Association of Realtors
Oshkosh-Neenah, WI Housing Market Statistics:
Average Home Value (2025): $249,423
Change in Home Value Since 2024: 5.9%
Source: Zillow
Oshkosh-Neenah, WI Economic Statistics:
Population Growth (2024): 0.6%
GDP Growth (2023): 0.3%
Job Growth (Q1-’25): -1.1%
Source: U.S. Census Bureau & National Association of Realtors
Lists That Mention Oshkosh-Neenah, WI:
Best Places to Live (U.S. News): #114
#47: Virginia Beach, VA
New to the list this year
Virginia Beach-Norfolk-Newport News, Virginia-North Carolina Metro Area Population: 1,781,671
Virginia Beach, VA Rental Market Statistics:
Asking Rent Growth Since Q1-’24: 2.9%
Multifamily Vacancy Rate (Q2-’24): 6.4%
Multifamily Cap Rate (Q2-’24): 6.3%
Source: National Association of Realtors
Virginia Beach, VA Housing Market Statistics:
Average Home Value (2025): $413,481
Change in Home Value Since 2024: 1.8%
Source: Zillow
Virginia Beach, VA Economic Statistics:
Population Growth (2024): 0.2%
GDP Growth (2023): 3.2%
Job Growth (Q1-’25): 0.4%
Source: U.S. Census Bureau & National Association of Realtors
Lists That Mention Virginia Beach, VA:
Best Real Estate Markets (WalletHub): #113
Best Places to Live (U.S. News): #134
#48: Seattle, WA
New to the list this year
Seattle-Tacoma-Bellevue, Washington Metro Area Population: 4,044,837
Seattle, WA Rental Market Statistics:
Asking Rent Growth Since Q1-’24: 1.5%
Multifamily Vacancy Rate (Q2-’24): 7.3%
Multifamily Cap Rate (Q2-’24): 4.9%
Source: National Association of Realtors
Seattle, WA Housing Market Statistics:
Average Home Value (2025): $847,418
Change in Home Value Since 2024: -2.0%
Source: Zillow
Seattle, WA Economic Statistics:
Population Growth (2024): 2.2%
GDP Growth (2023): 6.2%
Job Growth (Q1-’25): 0.8%
Source: U.S. Census Bureau & National Association of Realtors
Lists That Mention Seattle, WA:
Markets to Watch (PwC/ULI): #22
Best Real Estate Markets (WalletHub): #26
Best Places to Live (U.S. News): #126 (Bellevue, WA)
#49: El Paso, TX
No change in position since last year
El Paso, Texas Metro Area Population: 872,063
El Paso, TX Rental Market Statistics:
Asking Rent Growth Since Q1-’24: 0.6%
Multifamily Vacancy Rate (Q2-’24): 7.1%
Multifamily Cap Rate (Q2-’24): 7.2%
Source: National Association of Realtors
El Paso, TX Housing Market Statistics:
Average Home Value (2025): $229,135
Change in Home Value Since 2024: 0.7%
Source: Zillow
El Paso, TX Economic Statistics:
Population Growth (2024): 0.0%
GDP Growth (2023): 6.1%
Job Growth (Q1-’25): 1.5%
Source: U.S. Census Bureau & National Association of Realtors
Lists That Mention El Paso, TX:
Best Real Estate Markets (WalletHub): #144
Best Places to Live (U.S. News): #107
#50: Honolulu, HI
New to the list this year
Urban Honolulu, Hawaii Metro Area Population: 989,408
Honolulu, HI Rental Market Statistics:
Asking Rent Growth Since Q1-’24: 0.9%
Multifamily Vacancy Rate (Q2-’24): 3.9%
Multifamily Cap Rate (Q2-’24): 4.7%
Source: National Association of Realtors
Honolulu, HI Housing Market Statistics:
Average Home Value (2025): $755,526
Change in Home Value Since 2024: -1.9%
Source: Zillow
Honolulu, HI Economic Statistics:
Population Growth (2025): 0.4%
GDP Growth (2023): 2.4%
Job Growth (Q1-’25): 2.0%
Source: U.S. Census Bureau & National Association of Realtors
Lists That Mention Honolulu, HI:
Markets to Watch (PwC/ULI): #54
Best Real Estate Markets (WalletHub): #233
#51: Buffalo, NY
↓ 36 positions since last year
Buffalo-Cheektowaga, NY Metro Area Population: 1,155,604
Buffalo, NY Rental Market Statistics:
Asking Rent Growth Since Q1-’24: 2.8%
Multifamily Vacancy Rate (Q2-’24): 5.7%
Multifamily Cap Rate (Q2-’24): 7.2%
Source: National Association of Realtors
Buffalo, NY Housing Market Statistics:
Average Home Value (2025): $241,017
Change in Home Value Since 2024: 3.4%
Source: Zillow
Buffalo, NY Economic Statistics:
Population Growth (2024): 0.1%
GDP Growth (2023): 2.8%
Job Growth (Q1-’25): 0.8%
Source: U.S. Census Bureau & National Association of Realtors
Lists That Mention Buffalo, NY:
Markets to Watch (PwC/ULI): #75
Best Real Estate Markets (WalletHub): #67
#52: Abilene, TX
↓ 26 positions since last year
Abilene, Texas Metro Area Population: 180,224
Abilene, TX Rental Market Statistics:
Asking Rent Growth Since Q1-’24: 6.2%
Multifamily Vacancy Rate (Q2-’24): 8.4%
Multifamily Cap Rate (Q2-’24): 7.5%
Source: National Association of Realtors
Abilene, TX Housing Market Statistics:
Average Home Value (2025): $198,465
Change in Home Value Since 2024: 1.1%
Source: Zillow
Abilene, TX Economic Statistics:
Population Growth (2024): 0.8%
GDP Growth (2023): 3.3%
Job Growth (Q1-’25): 1.0%
Source: U.S. Census Bureau & National Association of Realtors
Lists That Mention Abilene, TX:
Best Places to Live (U.S. News): #120
#53: Allentown, PA
↓ 13 positions since last year
Allentown-Bethlehem-Easton, Pennsylvania Metro Area Population: 873,555
Allentown, PA Rental Market Statistics:
Asking Rent Growth Since Q1-’24: 4.0%
Multifamily Vacancy Rate (Q2-’24): 4.7%
Multifamily Cap Rate (Q2-’24): 6.8%
Source: National Association of Realtors
Allentown, PA Housing Market Statistics:
Average Home Value (2025): $305,255
Change in Home Value Since 2024: 4.1%
Source: Zillow
Allentown, PA Economic Statistics:
Population Growth (2024): 1.0%
GDP Growth (2023): 3.7%
Job Growth (Q1-’25): 1.4%
Source: U.S. Census Bureau & National Association of Realtors
Lists That Mention Allentown, PA:
Best Real Estate Markets (WalletHub): #108
#54: Miami, FL
New to the list this year
Miami-Fort Lauderdale-Pompano Beach, Florida Metro Area Population: 6,183,199
Miami, FL Rental Market Statistics:
Asking Rent Growth Since Q1-’24: 1.6%
Multifamily Vacancy Rate (Q2-’24): 6.3%
Multifamily Cap Rate (Q2-’24): 5.3%
Source: National Association of Realtors
Miami, FL Housing Market Statistics:
Average Home Value (2025): $578,128
Change in Home Value Since 2024: -3.0%
Source: Zillow
Miami, FL Economic Statistics:
Population Growth (2024): 3.5%
GDP Growth (2023): 4.0%
Job Growth (Q1-’25): 1.1%
Source: U.S. Census Bureau & National Association of Realtors
Lists That Mention Miami, FL:
Markets to Watch (PwC/ULI): #3
Best Real Estate Markets (WalletHub): #48
#55: Austin, TX (tie)
New to the list this year
Austin-Round Rock-Georgetown, Texas Metro Area Population: 2,473,275
Austin, TX Rental Market Statistics:
Asking Rent Growth Since Q1-’24: -4.1%
Multifamily Vacancy Rate (Q2-’24): 15.0%
Multifamily Cap Rate (Q2-’24): 5.4%
Source: National Association of Realtors
Austin, TX Housing Market Statistics:
Average Home Value (2025): $497,815
Change in Home Value Since 2024: 6.8%
Source: Zillow
Austin, TX Economic Statistics:
Population Growth (2025): 0.4%
GDP Growth (2023): 4.5%
Job Growth (Q1-’25): 1.3%
Source: U.S. Census Bureau & National Association of Realtors
Lists That Mention Austin, TX:
Markets to Watch (PwC/ULI): #30
Best Real Estate Markets (WalletHub): #18
Best Places to Live (U.S. News): #164
#55: Indianapolis, IN (tie)
↓ 5 positions since last year
Indianapolis-Carmel-Anderson, Indiana Metro Area Population: 2,139,689
Indianapolis, IN Rental Market Statistics:
Asking Rent Growth Since Q1-’24: -1.2%
Multifamily Vacancy Rate (Q2-’24): 12.6%
Multifamily Cap Rate (Q2-’24): 5.2%
Source: National Association of Realtors
Indianapolis, IN Housing Market Statistics:
Average Home Value (2025): $229,422
Change in Home Value Since 2024: 1.5%
Source: Zillow
Indianapolis, IN Economic Statistics:
Population Growth (2024): 0.6%
GDP Growth (2023): 4.6%
Job Growth (Q1-’25): 2.0%
Source: U.S. Census Bureau & National Association of Realtors
Lists That Mention Indianapolis, IN:
Markets to Watch (PwC/ULI): #42
Best Real Estate Markets (WalletHub): #226
Best Places to Live (U.S. News): #2 (Carmel, IN)
#57: Norwich-New London, CT
↓ 1 position since last year
Norwich-New London, Connecticut Metro Area Population: 279,634
Norwich-New London, CT Rental Market Statistics:
Asking Rent Growth Since Q1-’24: 3.6%
Multifamily Vacancy Rate (Q2-’24): 3.5%
Multifamily Cap Rate (Q2-’24): 0.9%
Source: National Association of Realtors
Norwich-New London, CT Housing Market Statistics:
Average Home Value (2025): $288,171
Change in Home Value Since 2024: 9.1%
Source: Zillow
Norwich-New London, CT Economic Statistics:
Population Growth (2024): 0.2%
GDP Growth (2023): 3.5%
Job Growth (Q1-’25): 0.9%
Source: U.S. Census Bureau & National Association of Realtors
Lists That Mention Norwich-New London, CT:
None – this is an under-the-radar pick
#58: New Orleans, LA
New to the list this year
New Orleans-Metairie, Louisiana Metro Area Population: 962,165
New Orleans, LA Rental Market Statistics:
Asking Rent Growth Since Q1-’24: 1.5%
Multifamily Vacancy Rate (Q2-’24): 8.7%
Multifamily Cap Rate (Q2-’24): 7.6%
Source: National Association of Realtors
New Orleans, LA Housing Market Statistics:
Average Home Value (2025): $238,620
Change in Home Value Since 2024: -2.6%
Source: Zillow
New Orleans, LA Economic Statistics:
Population Growth (2024): -0.7%
GDP Growth (2023): 5.0%
Job Growth (Q1-’25): 1.2%
Source: U.S. Census Bureau & National Association of Realtors
Lists That Mention New Orleans, LA:
Markets to Watch (PwC/ULI): #35
Best Real Estate Markets (WalletHub): #300
Best Places to Live (U.S. News): #161 (Metairie, LA)
#59: Tallahassee, FL
↓ 15 positions since last year
Tallahassee, Florida Metro Area Population: 393,414
Tallahassee, FL Rental Market Statistics:
Asking Rent Growth Since Q1-’24: 3.0%
Multifamily Vacancy Rate (Q2-’24): 9.9%
Multifamily Cap Rate (Q2-’24): 6.6%
Source: National Association of Realtors
Tallahassee, FL Housing Market Statistics:
Average Home Value (2025): $288,794
Change in Home Value Since 2024: -1.1%
Source: Zillow
Tallahassee, FL Economic Statistics:
Population Growth (2024): 0.7%
GDP Growth (2023): 4.0%
Job Growth (Q1-’25): 2.4%
Source: U.S. Census Bureau & National Association of Realtors
Lists That Mention Tallahassee, FL:
Markets to Watch (PwC/ULI): #33
Best Real Estate Markets (WalletHub): #154
#60: Cincinnati, OH
New to the list this year
Cincinnati, Ohio-Kentucky-Indiana Metro Area Population: 2,272,910
Cincinnati, OH Rental Market Statistics:
Asking Rent Growth Since Q1-’24: 3.0%
Multifamily Vacancy Rate (Q2-’24): 9.9%
Multifamily Cap Rate (Q2-’24): 6.6%
Source: National Association of Realtors
Cincinnati, OH Housing Market Statistics:
Average Home Value (2025): $246,428
Change in Home Value Since 2024: 1.2%
Source: Zillow
Cincinnati, OH Economic Statistics:
Population Growth (2024): 0.7%
GDP Growth (2023): 4.0%
Job Growth (Q1-’25): 2.4%
Source: U.S. Census Bureau & National Association of Realtors
Lists That Mention Cincinnati, OH:
Markets to Watch (PwC/ULI): #57
Best Real Estate Markets (WalletHub): #197
Methodology: How Do We Calculate Up-and-Coming Real Estate Markets?
Industry Indicators
Measures of opportunity for rental property investors and property managers:
- Markets with the best overall real estate investment prospects, as measured by PwC and the Urban Land Institute
- Housing markets with emerging investment opportunities, as measured by the Wall Street Journal and Realtor.com
- Markets with a greater number of renters relative to homeowners, as measured by the National Association of Realtors
- Markets with a high rate of renter household formation, as measured by the National Association of Realtors
Housing Indicators
Measures of property prices and rent growth:
- Markets with the highest growth in asking rents, as measured by the National Association of Realtors
- Markets with the lowest rental property vacancy rate, as measured by the National Association of Realtors
- Markets with the highest rental property cap rates, as measured by the National Association of Realtors
- Markets with the most home value appreciation, as measured by Zillow
Economic and Job Market Indicators
Measures of employment growth:
- Markets with the lowest unemployment rates, as measured by the National Association of Realtors
- Markets with the most employment growth, as measured by the National Association of Realtors
- Markets with the most GDP growth, as measured by the National Association of Realtors
Demographic Indicators
Measures of population growth:
- Markets with the greatest population growth, as measured by the U.S. Census Bureau
- The best places to live, based on analyses of quality of life and desirability, as measured by U.S. News
Climate Indicators
Measures of climate vulnerability:
- Markets with the lowest risk of natural disasters and extreme conditions, as measured by the Federal Emergency Management Agency